Pima vs Dutch West Indian 1 or more Vehicles in Household
COMPARE
Pima
Dutch West Indian
1 or more Vehicles in Household
1 or more Vehicles in Household Comparison
Pima
Dutch West Indians
86.3%
1 OR MORE VEHICLES IN HOUSEHOLD
0.0/ 100
METRIC RATING
291st/ 347
METRIC RANK
89.0%
1 OR MORE VEHICLES IN HOUSEHOLD
13.5/ 100
METRIC RATING
210th/ 347
METRIC RANK
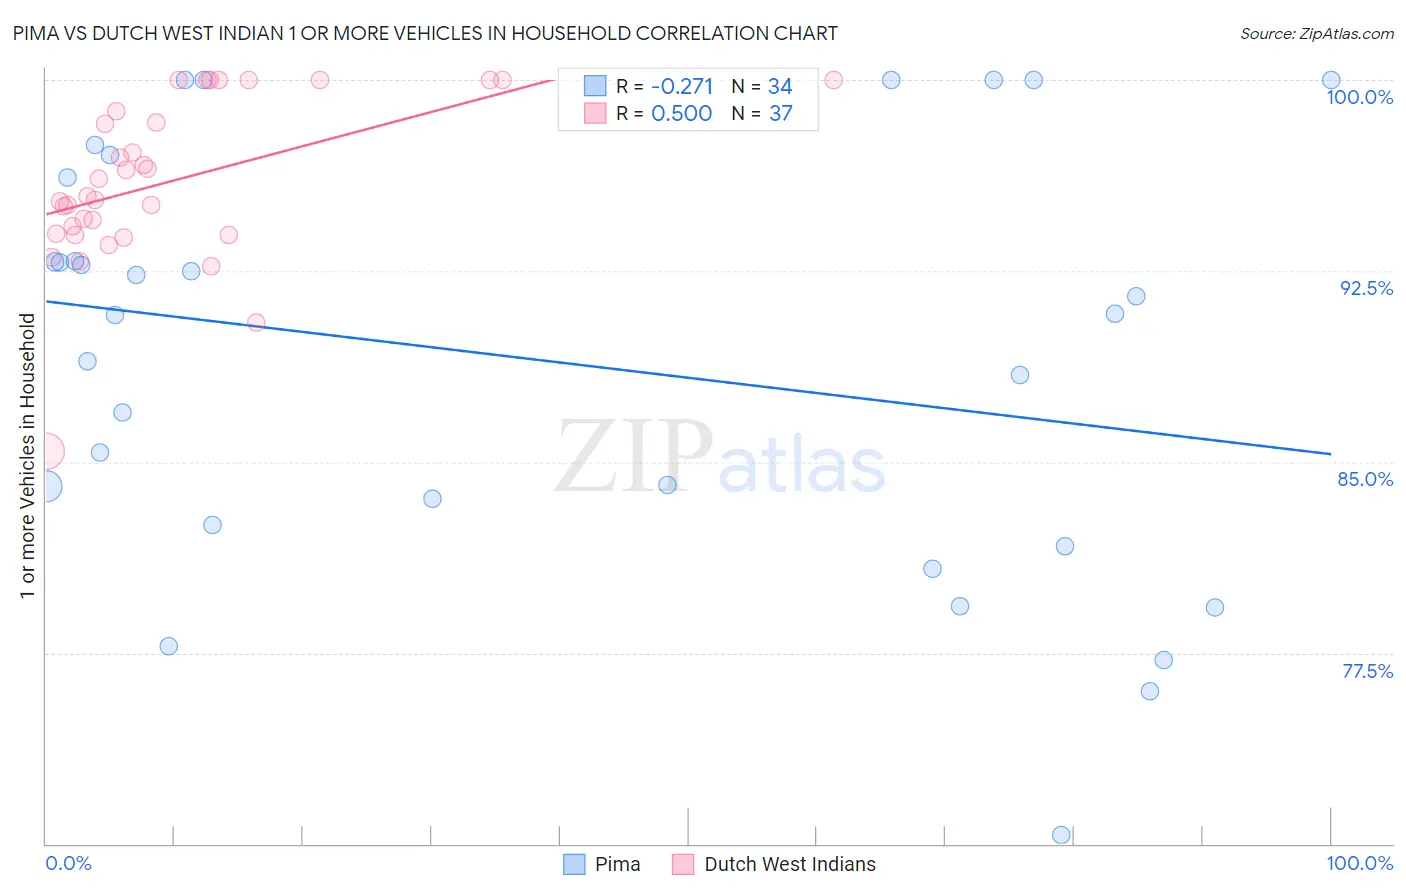
Pima vs Dutch West Indian 1 or more Vehicles in Household Correlation Chart
The statistical analysis conducted on geographies consisting of 61,539,566 people shows a weak negative correlation between the proportion of Pima and percentage of households with 1 or more vehicles available in the United States with a correlation coefficient (R) of -0.271 and weighted average of 86.3%. Similarly, the statistical analysis conducted on geographies consisting of 85,766,145 people shows a moderate positive correlation between the proportion of Dutch West Indians and percentage of households with 1 or more vehicles available in the United States with a correlation coefficient (R) of 0.500 and weighted average of 89.0%, a difference of 3.2%.
1 or more Vehicles in Household Correlation Summary
| Measurement | Pima | Dutch West Indian |
| Minimum | 70.4% | 85.4% |
| Maximum | 100.0% | 100.0% |
| Range | 29.6% | 14.6% |
| Mean | 89.0% | 96.0% |
| Median | 90.8% | 95.4% |
| Interquartile 25% (IQ1) | 82.5% | 93.9% |
| Interquartile 75% (IQ3) | 96.2% | 99.4% |
| Interquartile Range (IQR) | 13.6% | 5.4% |
| Standard Deviation (Sample) | 8.2% | 3.2% |
| Standard Deviation (Population) | 8.1% | 3.2% |
Similar Demographics by 1 or more Vehicles in Household
Demographics Similar to Pima by 1 or more Vehicles in Household
In terms of 1 or more vehicles in household, the demographic groups most similar to Pima are Immigrants from Australia (86.4%, a difference of 0.080%), Immigrants from Ireland (86.4%, a difference of 0.12%), Hopi (86.4%, a difference of 0.14%), Immigrants from Malaysia (86.5%, a difference of 0.21%), and Okinawan (86.1%, a difference of 0.23%).
| Demographics | Rating | Rank | 1 or more Vehicles in Household |
| Central American Indians | 0.0 /100 | #284 | Tragic 86.7% |
| Immigrants | Kazakhstan | 0.0 /100 | #285 | Tragic 86.6% |
| Immigrants | Eastern Asia | 0.0 /100 | #286 | Tragic 86.5% |
| Immigrants | Malaysia | 0.0 /100 | #287 | Tragic 86.5% |
| Hopi | 0.0 /100 | #288 | Tragic 86.4% |
| Immigrants | Ireland | 0.0 /100 | #289 | Tragic 86.4% |
| Immigrants | Australia | 0.0 /100 | #290 | Tragic 86.4% |
| Pima | 0.0 /100 | #291 | Tragic 86.3% |
| Okinawans | 0.0 /100 | #292 | Tragic 86.1% |
| Indians (Asian) | 0.0 /100 | #293 | Tragic 86.0% |
| Alaskan Athabascans | 0.0 /100 | #294 | Tragic 86.0% |
| Immigrants | Jamaica | 0.0 /100 | #295 | Tragic 85.8% |
| Immigrants | Spain | 0.0 /100 | #296 | Tragic 85.8% |
| Paraguayans | 0.0 /100 | #297 | Tragic 85.7% |
| Belizeans | 0.0 /100 | #298 | Tragic 85.7% |
Demographics Similar to Dutch West Indians by 1 or more Vehicles in Household
In terms of 1 or more vehicles in household, the demographic groups most similar to Dutch West Indians are Immigrants from Italy (89.1%, a difference of 0.020%), Sierra Leonean (89.0%, a difference of 0.020%), Immigrants from Chile (89.1%, a difference of 0.030%), Somali (89.0%, a difference of 0.030%), and Immigrants from Denmark (89.1%, a difference of 0.040%).
| Demographics | Rating | Rank | 1 or more Vehicles in Household |
| Cambodians | 18.9 /100 | #203 | Poor 89.2% |
| Romanians | 18.2 /100 | #204 | Poor 89.2% |
| Guatemalans | 17.8 /100 | #205 | Poor 89.2% |
| Apache | 16.2 /100 | #206 | Poor 89.1% |
| Immigrants | Denmark | 14.8 /100 | #207 | Poor 89.1% |
| Immigrants | Chile | 14.4 /100 | #208 | Poor 89.1% |
| Immigrants | Italy | 14.0 /100 | #209 | Poor 89.1% |
| Dutch West Indians | 13.5 /100 | #210 | Poor 89.0% |
| Sierra Leoneans | 13.0 /100 | #211 | Poor 89.0% |
| Somalis | 12.8 /100 | #212 | Poor 89.0% |
| Immigrants | Western Asia | 12.3 /100 | #213 | Poor 89.0% |
| Immigrants | Hungary | 11.9 /100 | #214 | Poor 89.0% |
| Immigrants | Sri Lanka | 10.2 /100 | #215 | Poor 88.9% |
| Immigrants | Argentina | 9.4 /100 | #216 | Tragic 88.9% |
| Argentineans | 8.8 /100 | #217 | Tragic 88.9% |