Hungarian vs Dutch West Indian Currently Married
COMPARE
Hungarian
Dutch West Indian
Currently Married
Currently Married Comparison
Hungarians
Dutch West Indians
48.8%
CURRENTLY MARRIED
99.4/ 100
METRIC RATING
37th/ 347
METRIC RANK
45.5%
CURRENTLY MARRIED
6.7/ 100
METRIC RATING
214th/ 347
METRIC RANK
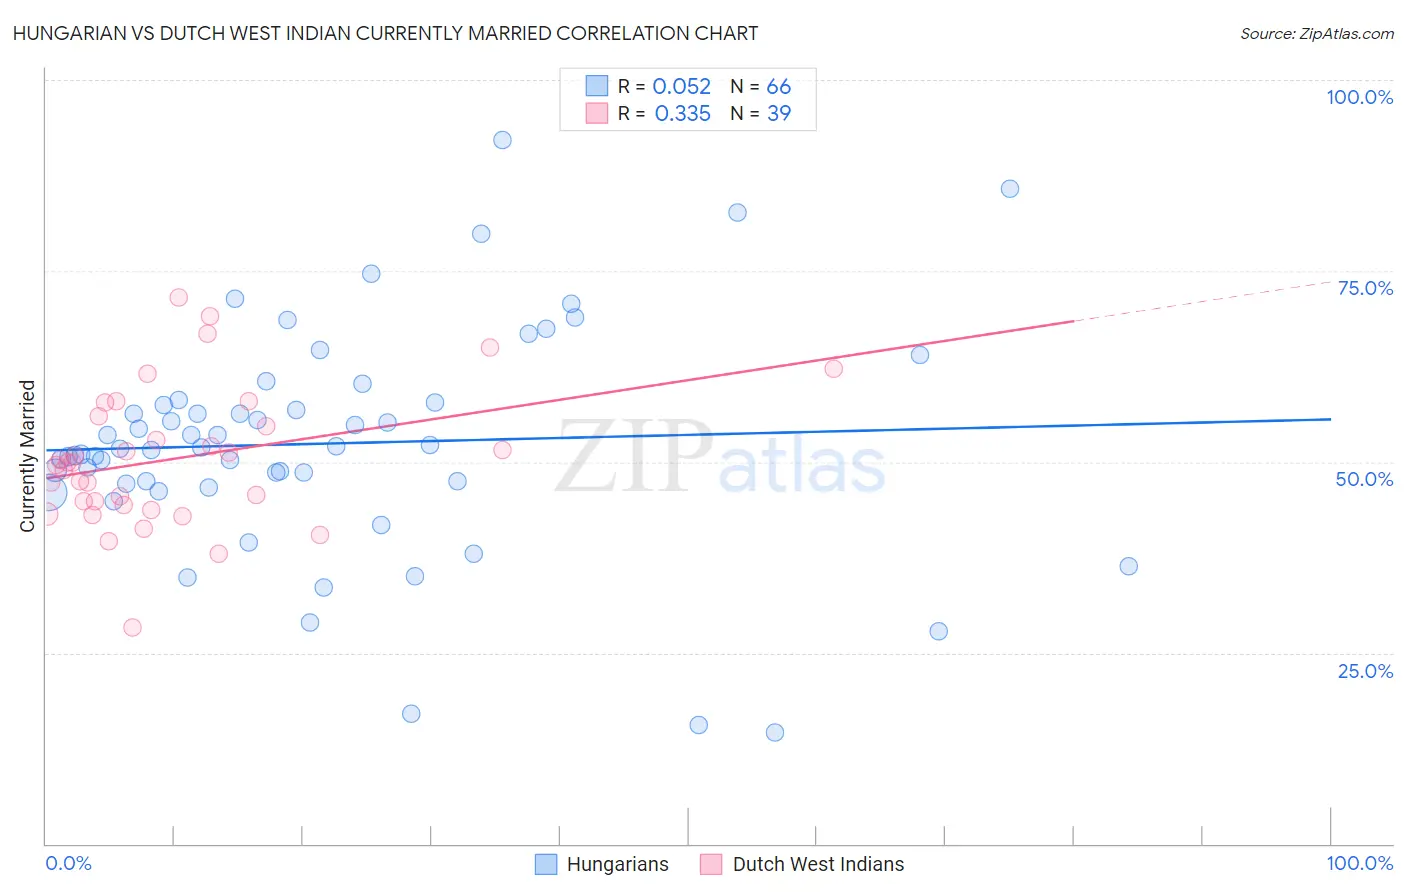
Hungarian vs Dutch West Indian Currently Married Correlation Chart
The statistical analysis conducted on geographies consisting of 486,182,197 people shows a slight positive correlation between the proportion of Hungarians and percentage of population currently married in the United States with a correlation coefficient (R) of 0.052 and weighted average of 48.8%. Similarly, the statistical analysis conducted on geographies consisting of 85,776,105 people shows a mild positive correlation between the proportion of Dutch West Indians and percentage of population currently married in the United States with a correlation coefficient (R) of 0.335 and weighted average of 45.5%, a difference of 7.3%.
Currently Married Correlation Summary
| Measurement | Hungarian | Dutch West Indian |
| Minimum | 14.5% | 28.4% |
| Maximum | 92.1% | 71.6% |
| Range | 77.6% | 43.2% |
| Mean | 52.4% | 50.4% |
| Median | 51.8% | 49.9% |
| Interquartile 25% (IQ1) | 47.1% | 44.3% |
| Interquartile 75% (IQ3) | 57.7% | 55.9% |
| Interquartile Range (IQR) | 10.6% | 11.6% |
| Standard Deviation (Sample) | 14.9% | 9.0% |
| Standard Deviation (Population) | 14.7% | 8.9% |
Similar Demographics by Currently Married
Demographics Similar to Hungarians by Currently Married
In terms of currently married, the demographic groups most similar to Hungarians are Italian (48.8%, a difference of 0.0%), Immigrants from Northern Europe (48.8%, a difference of 0.010%), Immigrants from Lithuania (48.8%, a difference of 0.030%), Czechoslovakian (48.8%, a difference of 0.040%), and British (48.8%, a difference of 0.070%).
| Demographics | Rating | Rank | Currently Married |
| Eastern Europeans | 99.5 /100 | #30 | Exceptional 48.9% |
| Poles | 99.5 /100 | #31 | Exceptional 48.9% |
| Immigrants | Hong Kong | 99.5 /100 | #32 | Exceptional 48.9% |
| Irish | 99.5 /100 | #33 | Exceptional 48.9% |
| Immigrants | Lithuania | 99.4 /100 | #34 | Exceptional 48.8% |
| Immigrants | Northern Europe | 99.4 /100 | #35 | Exceptional 48.8% |
| Italians | 99.4 /100 | #36 | Exceptional 48.8% |
| Hungarians | 99.4 /100 | #37 | Exceptional 48.8% |
| Czechoslovakians | 99.4 /100 | #38 | Exceptional 48.8% |
| British | 99.4 /100 | #39 | Exceptional 48.8% |
| Immigrants | Canada | 99.4 /100 | #40 | Exceptional 48.8% |
| Greeks | 99.3 /100 | #41 | Exceptional 48.8% |
| Finns | 99.3 /100 | #42 | Exceptional 48.8% |
| Scotch-Irish | 99.3 /100 | #43 | Exceptional 48.7% |
| Immigrants | North America | 99.3 /100 | #44 | Exceptional 48.7% |
Demographics Similar to Dutch West Indians by Currently Married
In terms of currently married, the demographic groups most similar to Dutch West Indians are German Russian (45.5%, a difference of 0.0%), Alaska Native (45.5%, a difference of 0.040%), Marshallese (45.5%, a difference of 0.070%), Houma (45.5%, a difference of 0.080%), and Uruguayan (45.6%, a difference of 0.16%).
| Demographics | Rating | Rank | Currently Married |
| Immigrants | South America | 10.8 /100 | #207 | Poor 45.7% |
| Alsatians | 10.8 /100 | #208 | Poor 45.7% |
| Immigrants | Micronesia | 8.8 /100 | #209 | Tragic 45.6% |
| Uruguayans | 7.9 /100 | #210 | Tragic 45.6% |
| Houma | 7.2 /100 | #211 | Tragic 45.5% |
| Marshallese | 7.2 /100 | #212 | Tragic 45.5% |
| Alaska Natives | 7.0 /100 | #213 | Tragic 45.5% |
| Dutch West Indians | 6.7 /100 | #214 | Tragic 45.5% |
| German Russians | 6.7 /100 | #215 | Tragic 45.5% |
| Immigrants | Morocco | 5.5 /100 | #216 | Tragic 45.4% |
| Immigrants | Thailand | 5.1 /100 | #217 | Tragic 45.4% |
| Panamanians | 4.0 /100 | #218 | Tragic 45.3% |
| Immigrants | Portugal | 3.5 /100 | #219 | Tragic 45.2% |
| Kenyans | 3.1 /100 | #220 | Tragic 45.2% |
| Mexicans | 3.0 /100 | #221 | Tragic 45.2% |