Pima vs Immigrants from Venezuela Currently Married
COMPARE
Pima
Immigrants from Venezuela
Currently Married
Currently Married Comparison
Pima
Immigrants from Venezuela
35.9%
CURRENTLY MARRIED
0.0/ 100
METRIC RATING
347th/ 347
METRIC RANK
47.0%
CURRENTLY MARRIED
68.6/ 100
METRIC RATING
153rd/ 347
METRIC RANK
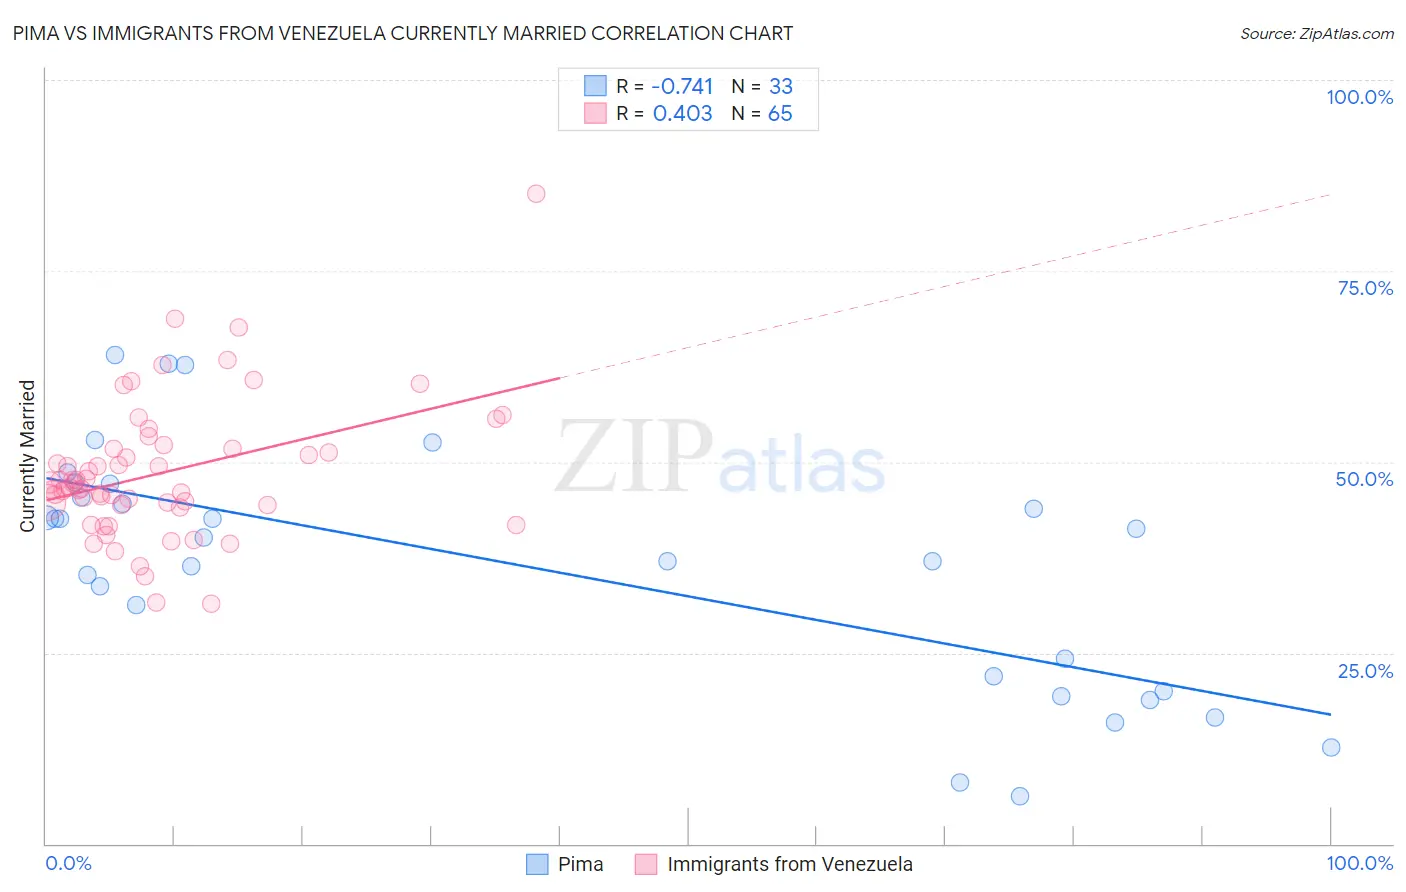
Pima vs Immigrants from Venezuela Currently Married Correlation Chart
The statistical analysis conducted on geographies consisting of 61,552,342 people shows a strong negative correlation between the proportion of Pima and percentage of population currently married in the United States with a correlation coefficient (R) of -0.741 and weighted average of 35.9%. Similarly, the statistical analysis conducted on geographies consisting of 287,838,026 people shows a moderate positive correlation between the proportion of Immigrants from Venezuela and percentage of population currently married in the United States with a correlation coefficient (R) of 0.403 and weighted average of 47.0%, a difference of 30.8%.
Currently Married Correlation Summary
| Measurement | Pima | Immigrants from Venezuela |
| Minimum | 6.2% | 31.4% |
| Maximum | 64.0% | 85.1% |
| Range | 57.8% | 53.7% |
| Mean | 36.3% | 48.6% |
| Median | 40.1% | 46.7% |
| Interquartile 25% (IQ1) | 21.0% | 44.3% |
| Interquartile 75% (IQ3) | 46.2% | 51.7% |
| Interquartile Range (IQR) | 25.2% | 7.4% |
| Standard Deviation (Sample) | 15.6% | 9.0% |
| Standard Deviation (Population) | 15.4% | 8.9% |
Similar Demographics by Currently Married
Demographics Similar to Pima by Currently Married
In terms of currently married, the demographic groups most similar to Pima are Hopi (36.5%, a difference of 1.8%), Tohono O'odham (36.8%, a difference of 2.4%), Immigrants from Cabo Verde (37.8%, a difference of 5.4%), Pueblo (38.2%, a difference of 6.5%), and Immigrants from Dominican Republic (38.9%, a difference of 8.4%).
| Demographics | Rating | Rank | Currently Married |
| Yup'ik | 0.0 /100 | #333 | Tragic 39.9% |
| Puerto Ricans | 0.0 /100 | #334 | Tragic 39.9% |
| Lumbee | 0.0 /100 | #335 | Tragic 39.8% |
| British West Indians | 0.0 /100 | #336 | Tragic 39.8% |
| Blacks/African Americans | 0.0 /100 | #337 | Tragic 39.6% |
| Cape Verdeans | 0.0 /100 | #338 | Tragic 39.6% |
| Dominicans | 0.0 /100 | #339 | Tragic 39.5% |
| Immigrants | Grenada | 0.0 /100 | #340 | Tragic 39.1% |
| Navajo | 0.0 /100 | #341 | Tragic 39.0% |
| Immigrants | Dominican Republic | 0.0 /100 | #342 | Tragic 38.9% |
| Pueblo | 0.0 /100 | #343 | Tragic 38.2% |
| Immigrants | Cabo Verde | 0.0 /100 | #344 | Tragic 37.8% |
| Tohono O'odham | 0.0 /100 | #345 | Tragic 36.8% |
| Hopi | 0.0 /100 | #346 | Tragic 36.5% |
| Pima | 0.0 /100 | #347 | Tragic 35.9% |
Demographics Similar to Immigrants from Venezuela by Currently Married
In terms of currently married, the demographic groups most similar to Immigrants from Venezuela are Albanian (47.0%, a difference of 0.0%), Arab (47.0%, a difference of 0.0%), Immigrants from Serbia (47.0%, a difference of 0.010%), Spanish (47.0%, a difference of 0.020%), and Immigrants from Switzerland (46.9%, a difference of 0.030%).
| Demographics | Rating | Rank | Currently Married |
| Carpatho Rusyns | 72.6 /100 | #146 | Good 47.0% |
| Immigrants | Argentina | 72.0 /100 | #147 | Good 47.0% |
| Cambodians | 70.4 /100 | #148 | Good 47.0% |
| Zimbabweans | 70.1 /100 | #149 | Good 47.0% |
| Immigrants | Turkey | 70.0 /100 | #150 | Good 47.0% |
| Chileans | 69.8 /100 | #151 | Good 47.0% |
| Immigrants | Serbia | 68.8 /100 | #152 | Good 47.0% |
| Immigrants | Venezuela | 68.6 /100 | #153 | Good 47.0% |
| Albanians | 68.6 /100 | #154 | Good 47.0% |
| Arabs | 68.6 /100 | #155 | Good 47.0% |
| Spanish | 68.1 /100 | #156 | Good 47.0% |
| Immigrants | Switzerland | 67.8 /100 | #157 | Good 46.9% |
| Cherokee | 66.8 /100 | #158 | Good 46.9% |
| Iraqis | 66.4 /100 | #159 | Good 46.9% |
| Immigrants | Uzbekistan | 66.0 /100 | #160 | Good 46.9% |