Moroccan vs Dutch West Indian Currently Married
COMPARE
Moroccan
Dutch West Indian
Currently Married
Currently Married Comparison
Moroccans
Dutch West Indians
44.6%
CURRENTLY MARRIED
0.9/ 100
METRIC RATING
238th/ 347
METRIC RANK
45.5%
CURRENTLY MARRIED
6.7/ 100
METRIC RATING
214th/ 347
METRIC RANK
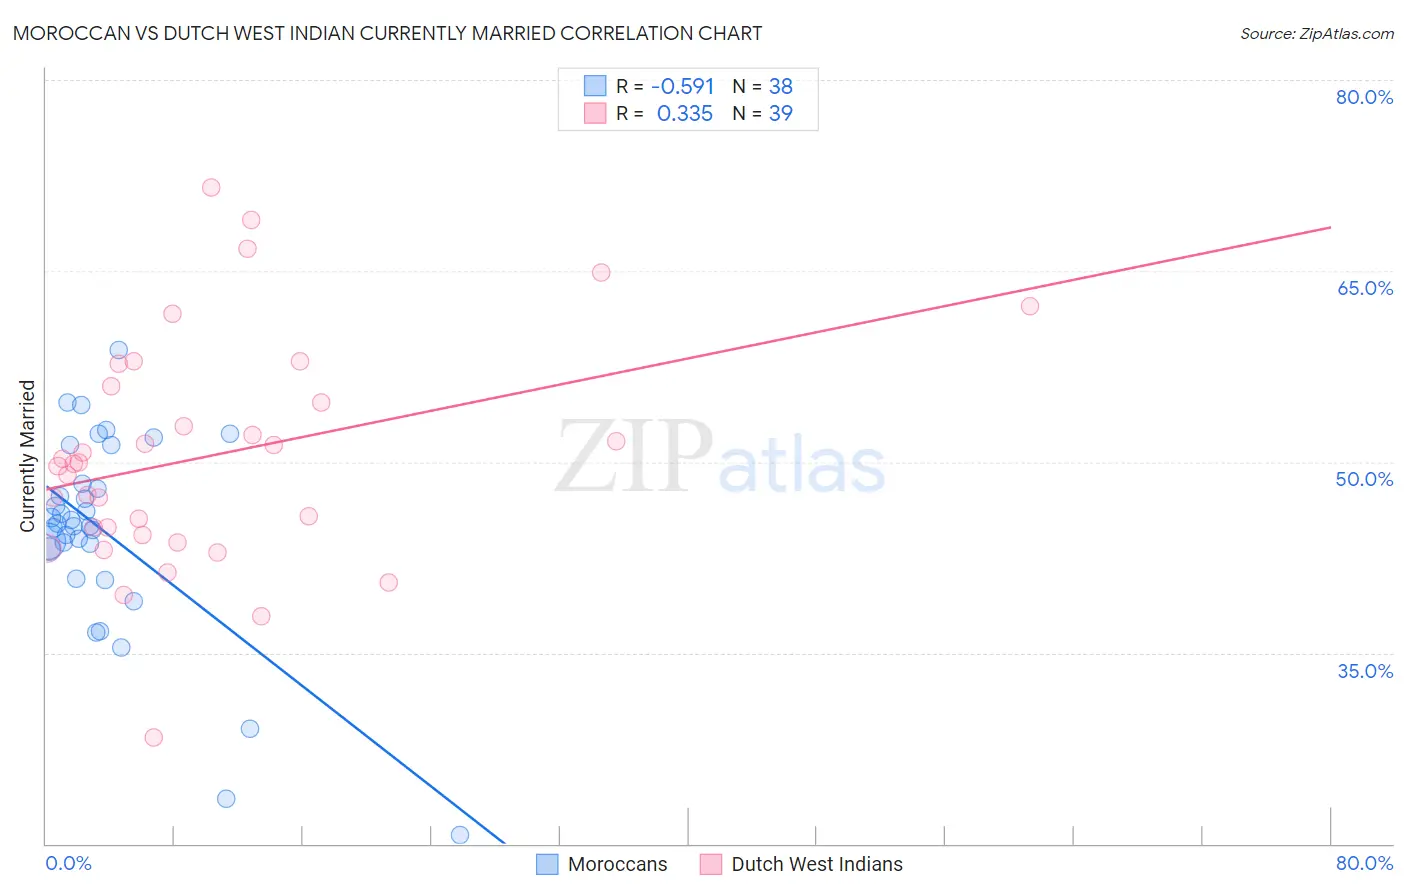
Moroccan vs Dutch West Indian Currently Married Correlation Chart
The statistical analysis conducted on geographies consisting of 201,812,139 people shows a substantial negative correlation between the proportion of Moroccans and percentage of population currently married in the United States with a correlation coefficient (R) of -0.591 and weighted average of 44.6%. Similarly, the statistical analysis conducted on geographies consisting of 85,776,105 people shows a mild positive correlation between the proportion of Dutch West Indians and percentage of population currently married in the United States with a correlation coefficient (R) of 0.335 and weighted average of 45.5%, a difference of 2.0%.
Currently Married Correlation Summary
| Measurement | Moroccan | Dutch West Indian |
| Minimum | 20.7% | 28.4% |
| Maximum | 58.8% | 71.6% |
| Range | 38.1% | 43.2% |
| Mean | 44.4% | 50.4% |
| Median | 45.0% | 49.9% |
| Interquartile 25% (IQ1) | 43.1% | 44.3% |
| Interquartile 75% (IQ3) | 48.3% | 55.9% |
| Interquartile Range (IQR) | 5.2% | 11.6% |
| Standard Deviation (Sample) | 7.9% | 9.0% |
| Standard Deviation (Population) | 7.8% | 8.9% |
Similar Demographics by Currently Married
Demographics Similar to Moroccans by Currently Married
In terms of currently married, the demographic groups most similar to Moroccans are Cuban (44.6%, a difference of 0.080%), Seminole (44.6%, a difference of 0.080%), Alaskan Athabascan (44.6%, a difference of 0.090%), Immigrants from Mexico (44.5%, a difference of 0.14%), and Mexican American Indian (44.5%, a difference of 0.14%).
| Demographics | Rating | Rank | Currently Married |
| Immigrants | Panama | 1.5 /100 | #231 | Tragic 44.9% |
| Nepalese | 1.2 /100 | #232 | Tragic 44.7% |
| Immigrants | Saudi Arabia | 1.1 /100 | #233 | Tragic 44.7% |
| Iroquois | 1.1 /100 | #234 | Tragic 44.7% |
| Alaskan Athabascans | 0.9 /100 | #235 | Tragic 44.6% |
| Cubans | 0.9 /100 | #236 | Tragic 44.6% |
| Seminole | 0.9 /100 | #237 | Tragic 44.6% |
| Moroccans | 0.9 /100 | #238 | Tragic 44.6% |
| Immigrants | Mexico | 0.7 /100 | #239 | Tragic 44.5% |
| Mexican American Indians | 0.7 /100 | #240 | Tragic 44.5% |
| Ethiopians | 0.7 /100 | #241 | Tragic 44.5% |
| Immigrants | Cambodia | 0.7 /100 | #242 | Tragic 44.5% |
| Immigrants | Ethiopia | 0.7 /100 | #243 | Tragic 44.5% |
| Japanese | 0.6 /100 | #244 | Tragic 44.5% |
| Immigrants | Armenia | 0.4 /100 | #245 | Tragic 44.3% |
Demographics Similar to Dutch West Indians by Currently Married
In terms of currently married, the demographic groups most similar to Dutch West Indians are German Russian (45.5%, a difference of 0.0%), Alaska Native (45.5%, a difference of 0.040%), Marshallese (45.5%, a difference of 0.070%), Houma (45.5%, a difference of 0.080%), and Uruguayan (45.6%, a difference of 0.16%).
| Demographics | Rating | Rank | Currently Married |
| Immigrants | South America | 10.8 /100 | #207 | Poor 45.7% |
| Alsatians | 10.8 /100 | #208 | Poor 45.7% |
| Immigrants | Micronesia | 8.8 /100 | #209 | Tragic 45.6% |
| Uruguayans | 7.9 /100 | #210 | Tragic 45.6% |
| Houma | 7.2 /100 | #211 | Tragic 45.5% |
| Marshallese | 7.2 /100 | #212 | Tragic 45.5% |
| Alaska Natives | 7.0 /100 | #213 | Tragic 45.5% |
| Dutch West Indians | 6.7 /100 | #214 | Tragic 45.5% |
| German Russians | 6.7 /100 | #215 | Tragic 45.5% |
| Immigrants | Morocco | 5.5 /100 | #216 | Tragic 45.4% |
| Immigrants | Thailand | 5.1 /100 | #217 | Tragic 45.4% |
| Panamanians | 4.0 /100 | #218 | Tragic 45.3% |
| Immigrants | Portugal | 3.5 /100 | #219 | Tragic 45.2% |
| Kenyans | 3.1 /100 | #220 | Tragic 45.2% |
| Mexicans | 3.0 /100 | #221 | Tragic 45.2% |