Pima vs Scandinavian Currently Married
COMPARE
Pima
Scandinavian
Currently Married
Currently Married Comparison
Pima
Scandinavians
35.9%
CURRENTLY MARRIED
0.0/ 100
METRIC RATING
347th/ 347
METRIC RANK
49.5%
CURRENTLY MARRIED
99.9/ 100
METRIC RATING
17th/ 347
METRIC RANK
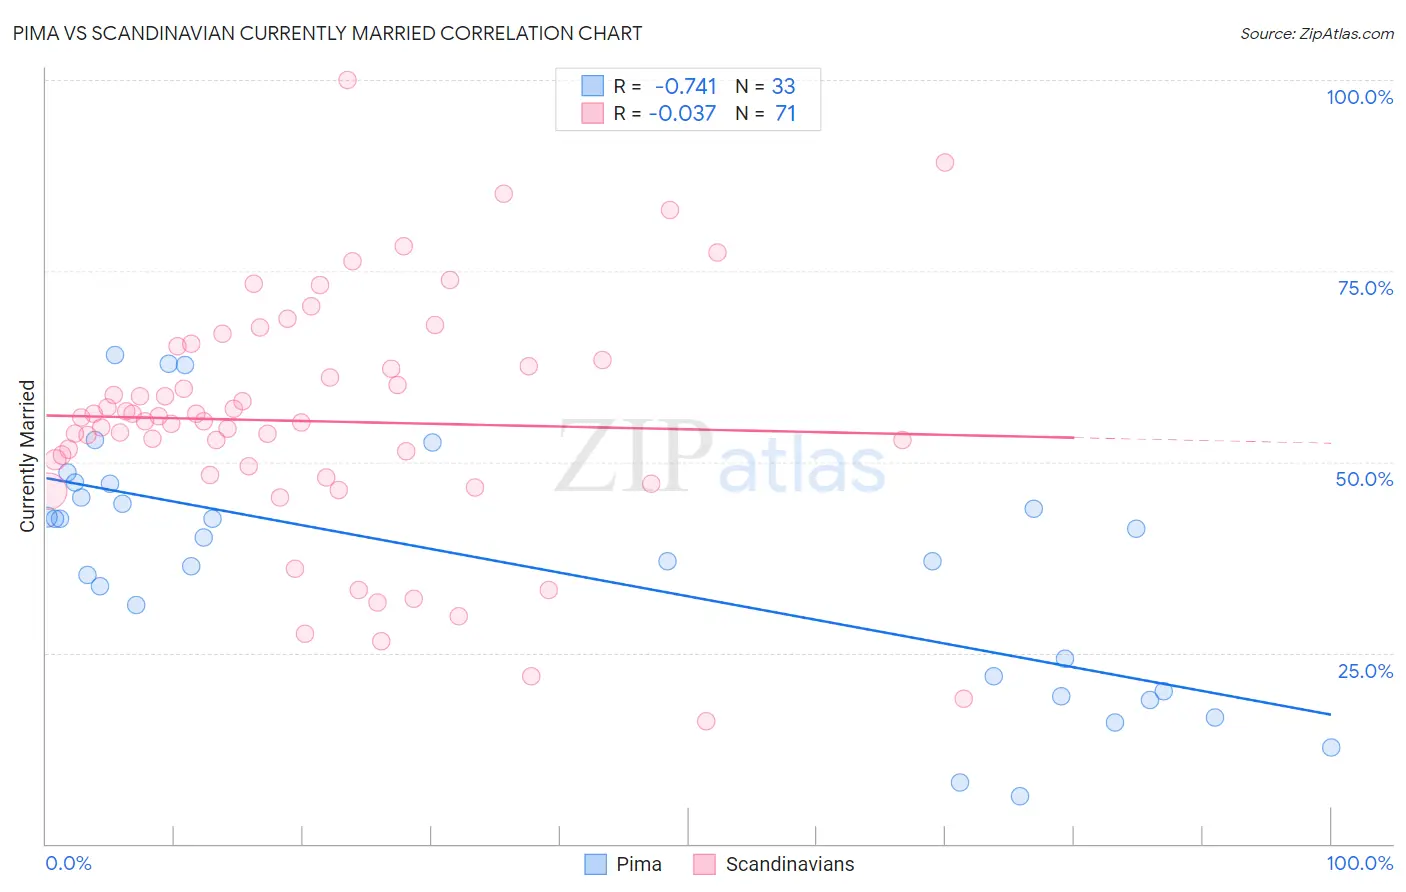
Pima vs Scandinavian Currently Married Correlation Chart
The statistical analysis conducted on geographies consisting of 61,552,342 people shows a strong negative correlation between the proportion of Pima and percentage of population currently married in the United States with a correlation coefficient (R) of -0.741 and weighted average of 35.9%. Similarly, the statistical analysis conducted on geographies consisting of 472,583,978 people shows no correlation between the proportion of Scandinavians and percentage of population currently married in the United States with a correlation coefficient (R) of -0.037 and weighted average of 49.5%, a difference of 37.8%.
Currently Married Correlation Summary
| Measurement | Pima | Scandinavian |
| Minimum | 6.2% | 16.0% |
| Maximum | 64.0% | 100.0% |
| Range | 57.8% | 84.0% |
| Mean | 36.3% | 55.3% |
| Median | 40.1% | 55.3% |
| Interquartile 25% (IQ1) | 21.0% | 48.3% |
| Interquartile 75% (IQ3) | 46.2% | 63.3% |
| Interquartile Range (IQR) | 25.2% | 15.0% |
| Standard Deviation (Sample) | 15.6% | 16.0% |
| Standard Deviation (Population) | 15.4% | 15.9% |
Similar Demographics by Currently Married
Demographics Similar to Pima by Currently Married
In terms of currently married, the demographic groups most similar to Pima are Hopi (36.5%, a difference of 1.8%), Tohono O'odham (36.8%, a difference of 2.4%), Immigrants from Cabo Verde (37.8%, a difference of 5.4%), Pueblo (38.2%, a difference of 6.5%), and Immigrants from Dominican Republic (38.9%, a difference of 8.4%).
| Demographics | Rating | Rank | Currently Married |
| Yup'ik | 0.0 /100 | #333 | Tragic 39.9% |
| Puerto Ricans | 0.0 /100 | #334 | Tragic 39.9% |
| Lumbee | 0.0 /100 | #335 | Tragic 39.8% |
| British West Indians | 0.0 /100 | #336 | Tragic 39.8% |
| Blacks/African Americans | 0.0 /100 | #337 | Tragic 39.6% |
| Cape Verdeans | 0.0 /100 | #338 | Tragic 39.6% |
| Dominicans | 0.0 /100 | #339 | Tragic 39.5% |
| Immigrants | Grenada | 0.0 /100 | #340 | Tragic 39.1% |
| Navajo | 0.0 /100 | #341 | Tragic 39.0% |
| Immigrants | Dominican Republic | 0.0 /100 | #342 | Tragic 38.9% |
| Pueblo | 0.0 /100 | #343 | Tragic 38.2% |
| Immigrants | Cabo Verde | 0.0 /100 | #344 | Tragic 37.8% |
| Tohono O'odham | 0.0 /100 | #345 | Tragic 36.8% |
| Hopi | 0.0 /100 | #346 | Tragic 36.5% |
| Pima | 0.0 /100 | #347 | Tragic 35.9% |
Demographics Similar to Scandinavians by Currently Married
In terms of currently married, the demographic groups most similar to Scandinavians are Chinese (49.5%, a difference of 0.020%), Pennsylvania German (49.6%, a difference of 0.16%), German (49.6%, a difference of 0.19%), Dutch (49.6%, a difference of 0.20%), and Immigrants from Scotland (49.3%, a difference of 0.29%).
| Demographics | Rating | Rank | Currently Married |
| Filipinos | 99.9 /100 | #10 | Exceptional 49.7% |
| English | 99.9 /100 | #11 | Exceptional 49.7% |
| Swiss | 99.9 /100 | #12 | Exceptional 49.7% |
| Dutch | 99.9 /100 | #13 | Exceptional 49.6% |
| Germans | 99.9 /100 | #14 | Exceptional 49.6% |
| Pennsylvania Germans | 99.9 /100 | #15 | Exceptional 49.6% |
| Chinese | 99.9 /100 | #16 | Exceptional 49.5% |
| Scandinavians | 99.9 /100 | #17 | Exceptional 49.5% |
| Immigrants | Scotland | 99.8 /100 | #18 | Exceptional 49.3% |
| Europeans | 99.8 /100 | #19 | Exceptional 49.3% |
| Luxembourgers | 99.8 /100 | #20 | Exceptional 49.3% |
| Scottish | 99.8 /100 | #21 | Exceptional 49.2% |
| Bulgarians | 99.7 /100 | #22 | Exceptional 49.1% |
| Immigrants | Pakistan | 99.7 /100 | #23 | Exceptional 49.1% |
| Lithuanians | 99.6 /100 | #24 | Exceptional 49.0% |