Icelander vs African Currently Married

COMPARE

Icelander
Race
Ancestry
AfghanAlaska NativeAlaskan AthabascanAlbanianAleutAlsatianAmericanApacheArabArapahoArgentineanArmenianAssyrian/Chaldean/SyriacAustralianAustrianBahamianBangladeshiBarbadianBasqueBelgianBelizeanBermudanBhutaneseBlackfeetBolivianBrazilianBritishBritish West IndianBulgarianBurmeseCajunCambodianCanadianCape VerdeanCarpatho RusynCelticCentral AmericanCentral American IndianCherokeeCheyenneChickasawChileanChineseChippewaChoctawColombianColvilleComancheCosta RicanCreeCreekCroatianCrowCubanCypriotCzechCzechoslovakianDanishDelawareDominicanDutchDutch West IndianEastern EuropeanEcuadorianEgyptianEnglishEstonianEthiopianEuropeanFijianFilipinoFinnishFrenchFrench American IndianFrench CanadianGermanGerman RussianGhanaianGreekGuamanian/ChamorroGuatemalanGuyaneseHaitianHmongHonduranHopiHoumaHungarianIcelanderIndian (Asian)IndonesianInupiatIranianIraqiIrishIroquoisIsraeliItalianJamaicanJapaneseJordanianKenyanKiowaKoreanLaotianLatvianLebaneseLiberianLithuanianLumbeeLuxembourgerMacedonianMalaysianMalteseMarshalleseMenomineeMexicanMexican American IndianMongolianMoroccanNative HawaiianNavajoNepaleseNew ZealanderNicaraguanNigerianNorthern EuropeanNorwegianOkinawanOsageOttawaPaiutePakistaniPalestinianPanamanianParaguayanPennsylvania GermanPeruvianPimaPolishPortuguesePotawatomiPuebloPuerto RicanPuget Sound SalishRomanianRussianSalvadoranSamoanScandinavianScotch-IrishScottishSeminoleSenegaleseSerbianShoshoneSierra LeoneanSiouxSlavicSlovakSloveneSomaliSouth AfricanSouth AmericanSouth American IndianSoviet UnionSpaniardSpanishSpanish AmericanSpanish American IndianSri LankanSubsaharan AfricanSudaneseSwedishSwissSyrianTaiwaneseThaiTlingit-HaidaTohono O'OdhamTonganTrinidadian and TobagonianTsimshianTurkishU.S. Virgin IslanderUgandanUkrainianUruguayanUteVenezuelanVietnameseWelshWest IndianYakamaYaquiYugoslavianYumanYup'ikZimbabwean
Immigration
NonimmigrantsImmigrantsAfghanistanAfricaAlbaniaArgentinaArmeniaAsiaAustraliaAustriaBahamasBangladeshBarbadosBelarusBelgiumBelizeBoliviaBosnia and HerzegovinaBrazilBulgariaBurma/MyanmarCabo VerdeCambodiaCameroonCanadaCaribbeanCentral AmericaChileChinaColombiaCongoCosta RicaCroatiaCubaCzechoslovakiaDenmarkDominicaDominican RepublicEastern AfricaEastern AsiaEastern EuropeEcuadorEgyptEl SalvadorEnglandEritreaEthiopiaEuropeFijiFranceGermanyGhanaGreeceGrenadaGuatemalaGuyanaHaitiHondurasHong KongHungaryIndiaIndonesiaIranIraqIrelandIsraelItalyJamaicaJapanJordanKazakhstanKenyaKoreaKuwaitLaosLatin AmericaLatviaLebanonLiberiaLithuaniaMalaysiaMexicoMicronesiaMiddle AfricaMoldovaMoroccoNepalNetherlandsNicaraguaNigeriaNorth AmericaNorth MacedoniaNorthern AfricaNorthern EuropeNorwayOceaniaPakistanPanamaPeruPhilippinesPolandPortugalRomaniaRussiaSaudi ArabiaScotlandSenegalSerbiaSierra LeoneSingaporeSomaliaSouth AfricaSouth AmericaSouth Central AsiaSouth Eastern AsiaSouthern EuropeSpainSri LankaSt. Vincent and the GrenadinesSudanSwedenSwitzerlandSyriaTaiwanThailandTrinidad and TobagoTurkeyUgandaUkraineUruguayUzbekistanVenezuelaVietnamWest IndiesWestern AfricaWestern AsiaWestern EuropeYemenZaireZimbabweAzores
African
Race
Ancestry
AfghanAfricanAlaska NativeAlaskan AthabascanAlbanianAleutAlsatianAmericanApacheArabArapahoArgentineanArmenianAssyrian/Chaldean/SyriacAustralianAustrianBahamianBangladeshiBarbadianBasqueBelgianBelizeanBermudanBhutaneseBlackfeetBolivianBrazilianBritishBritish West IndianBulgarianBurmeseCajunCambodianCanadianCape VerdeanCarpatho RusynCelticCentral AmericanCentral American IndianCherokeeCheyenneChickasawChileanChineseChippewaChoctawColombianColvilleComancheCosta RicanCreeCreekCroatianCrowCubanCypriotCzechCzechoslovakianDanishDelawareDominicanDutchDutch West IndianEastern EuropeanEcuadorianEgyptianEnglishEstonianEthiopianEuropeanFijianFilipinoFinnishFrenchFrench American IndianFrench CanadianGermanGerman RussianGhanaianGreekGuamanian/ChamorroGuatemalanGuyaneseHaitianHmongHonduranHopiHoumaHungarianIndian (Asian)IndonesianInupiatIranianIraqiIrishIroquoisIsraeliItalianJamaicanJapaneseJordanianKenyanKiowaKoreanLaotianLatvianLebaneseLiberianLithuanianLumbeeLuxembourgerMacedonianMalaysianMalteseMarshalleseMenomineeMexicanMexican American IndianMongolianMoroccanNative HawaiianNavajoNepaleseNew ZealanderNicaraguanNigerianNorthern EuropeanNorwegianOkinawanOsageOttawaPaiutePakistaniPalestinianPanamanianParaguayanPennsylvania GermanPeruvianPimaPolishPortuguesePotawatomiPuebloPuerto RicanPuget Sound SalishRomanianRussianSalvadoranSamoanScandinavianScotch-IrishScottishSeminoleSenegaleseSerbianShoshoneSierra LeoneanSiouxSlavicSlovakSloveneSomaliSouth AfricanSouth AmericanSouth American IndianSoviet UnionSpaniardSpanishSpanish AmericanSpanish American IndianSri LankanSubsaharan AfricanSudaneseSwedishSwissSyrianTaiwaneseThaiTlingit-HaidaTohono O'OdhamTonganTrinidadian and TobagonianTsimshianTurkishU.S. Virgin IslanderUgandanUkrainianUruguayanUteVenezuelanVietnameseWelshWest IndianYakamaYaquiYugoslavianYumanYup'ikZimbabwean
Immigration
NonimmigrantsImmigrantsAfghanistanAfricaAlbaniaArgentinaArmeniaAsiaAustraliaAustriaBahamasBangladeshBarbadosBelarusBelgiumBelizeBoliviaBosnia and HerzegovinaBrazilBulgariaBurma/MyanmarCabo VerdeCambodiaCameroonCanadaCaribbeanCentral AmericaChileChinaColombiaCongoCosta RicaCroatiaCubaCzechoslovakiaDenmarkDominicaDominican RepublicEastern AfricaEastern AsiaEastern EuropeEcuadorEgyptEl SalvadorEnglandEritreaEthiopiaEuropeFijiFranceGermanyGhanaGreeceGrenadaGuatemalaGuyanaHaitiHondurasHong KongHungaryIndiaIndonesiaIranIraqIrelandIsraelItalyJamaicaJapanJordanKazakhstanKenyaKoreaKuwaitLaosLatin AmericaLatviaLebanonLiberiaLithuaniaMalaysiaMexicoMicronesiaMiddle AfricaMoldovaMoroccoNepalNetherlandsNicaraguaNigeriaNorth AmericaNorth MacedoniaNorthern AfricaNorthern EuropeNorwayOceaniaPakistanPanamaPeruPhilippinesPolandPortugalRomaniaRussiaSaudi ArabiaScotlandSenegalSerbiaSierra LeoneSingaporeSomaliaSouth AfricaSouth AmericaSouth Central AsiaSouth Eastern AsiaSouthern EuropeSpainSri LankaSt. Vincent and the GrenadinesSudanSwedenSwitzerlandSyriaTaiwanThailandTrinidad and TobagoTurkeyUgandaUkraineUruguayUzbekistanVenezuelaVietnamWest IndiesWestern AfricaWestern AsiaWestern EuropeYemenZaireZimbabweAzores
Currently Married
Income
Poverty
Unemployment
Labor Participation
Family Structure
Vehicle Availability
Education Level
Disability

Currently Married Comparison

Icelanders

Africans

Excellent
Tragic
47.3%
CURRENTLY MARRIED
82.4/ 100
METRIC RATING
131st/ 347
METRIC RANK
41.8%
CURRENTLY MARRIED
0.0/ 100
METRIC RATING
307th/ 347
METRIC RANK

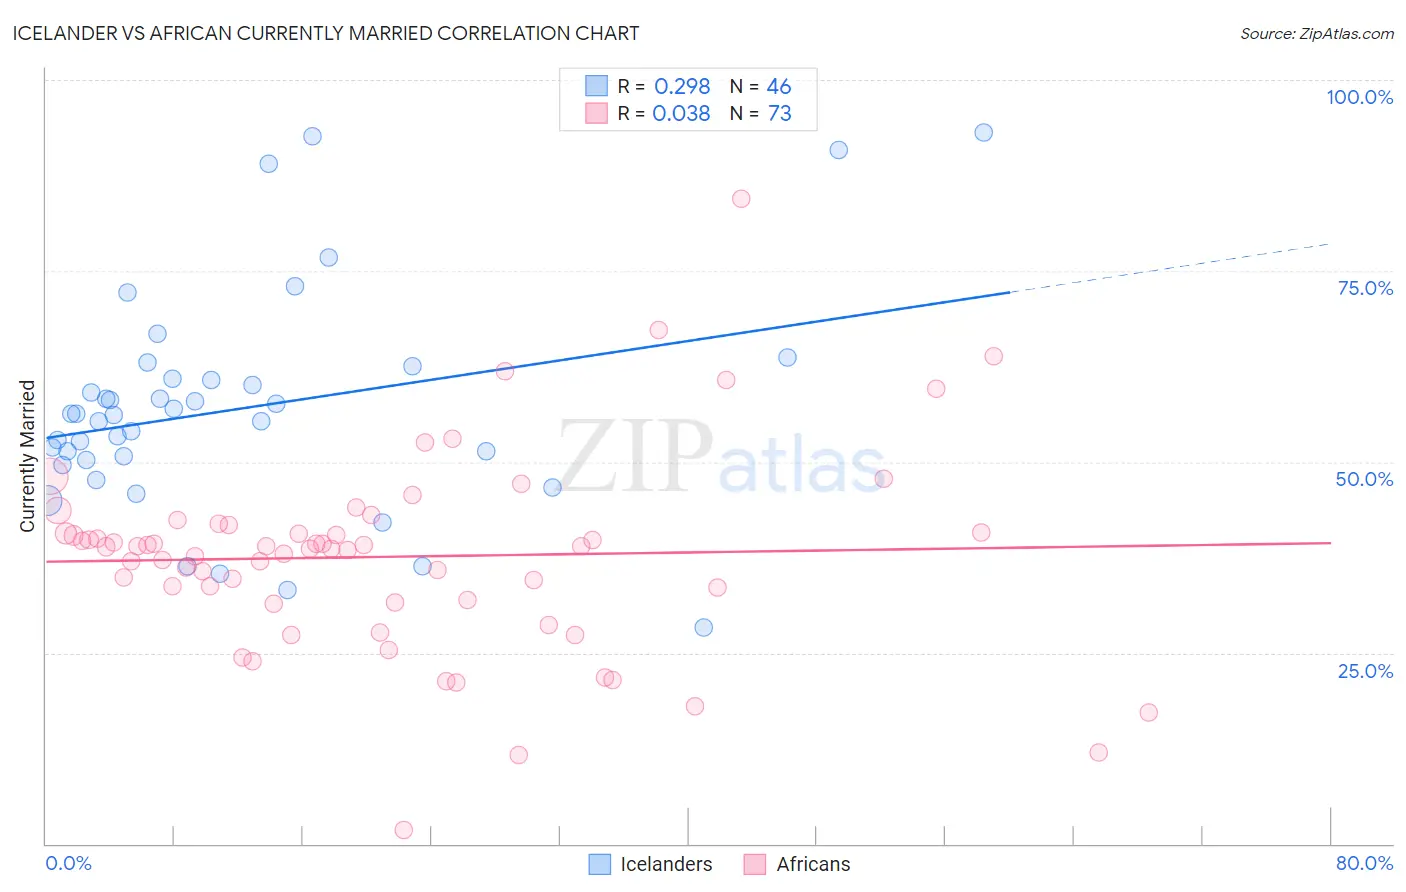
Icelander vs African Currently Married Correlation Chart

The statistical analysis conducted on geographies consisting of 159,647,895 people shows a weak positive correlation between the proportion of Icelanders and percentage of population currently married in the United States with a correlation coefficient (R) of 0.298 and weighted average of 47.3%. Similarly, the statistical analysis conducted on geographies consisting of 470,023,481 people shows no correlation between the proportion of Africans and percentage of population currently married in the United States with a correlation coefficient (R) of 0.038 and weighted average of 41.8%, a difference of 13.1%.
Icelander vs African Currently Married

Currently Married Correlation Summary

MeasurementIcelanderAfrican
Minimum28.3%1.8%
Maximum93.2%84.5%
Range64.9%82.7%
Mean57.1%37.6%
Median56.2%38.9%
Interquartile 25% (IQ1)50.3%31.7%
Interquartile 75% (IQ3)60.9%41.2%
Interquartile Range (IQR)10.6%9.4%
Standard Deviation (Sample)14.6%12.9%
Standard Deviation (Population)14.4%12.8%

Similar Demographics by Currently Married

Demographics Similar to Icelanders by Currently Married

In terms of currently married, the demographic groups most similar to Icelanders are Immigrants from Iraq (47.3%, a difference of 0.020%), Afghan (47.3%, a difference of 0.040%), Sri Lankan (47.3%, a difference of 0.050%), Immigrants from Malaysia (47.3%, a difference of 0.080%), and Immigrants from Australia (47.3%, a difference of 0.080%).
DemographicsRating | RankCurrently Married
Laotians
86.6
/100
|
#124
Excellent
47.4%
Okinawans
85.3
/100
|
#125
Excellent
47.4%
Immigrants | Jordan
84.9
/100
|
#126
Excellent
47.4%
New Zealanders
84.9
/100
|
#127
Excellent
47.4%
Portuguese
84.2
/100
|
#128
Excellent
47.3%
Sri Lankans
83.2
/100
|
#129
Excellent
47.3%
Immigrants | Iraq
82.8
/100
|
#130
Excellent
47.3%
Icelanders
82.4
/100
|
#131
Excellent
47.3%
Afghans
81.8
/100
|
#132
Excellent
47.3%
Immigrants | Malaysia
81.1
/100
|
#133
Excellent
47.3%
Immigrants | Australia
81.1
/100
|
#134
Excellent
47.3%
Immigrants | Norway
79.7
/100
|
#135
Good
47.2%
Immigrants | Vietnam
78.2
/100
|
#136
Good
47.2%
Paraguayans
77.8
/100
|
#137
Good
47.2%
Pakistanis
77.5
/100
|
#138
Good
47.2%

Demographics Similar to Africans by Currently Married

In terms of currently married, the demographic groups most similar to Africans are Immigrants from Belize (41.8%, a difference of 0.040%), Immigrants from Guyana (41.9%, a difference of 0.13%), Immigrants from Trinidad and Tobago (41.9%, a difference of 0.14%), Immigrants from Liberia (41.8%, a difference of 0.15%), and Immigrants from Bahamas (41.9%, a difference of 0.18%).
DemographicsRating | RankCurrently Married
Belizeans
0.0
/100
|
#300
Tragic
42.2%
Immigrants | Yemen
0.0
/100
|
#301
Tragic
42.1%
Immigrants | Zaire
0.0
/100
|
#302
Tragic
42.0%
Sioux
0.0
/100
|
#303
Tragic
41.9%
Immigrants | Bahamas
0.0
/100
|
#304
Tragic
41.9%
Immigrants | Trinidad and Tobago
0.0
/100
|
#305
Tragic
41.9%
Immigrants | Guyana
0.0
/100
|
#306
Tragic
41.9%
Africans
0.0
/100
|
#307
Tragic
41.8%
Immigrants | Belize
0.0
/100
|
#308
Tragic
41.8%
Immigrants | Liberia
0.0
/100
|
#309
Tragic
41.8%
Guyanese
0.0
/100
|
#310
Tragic
41.6%
Trinidadians and Tobagonians
0.0
/100
|
#311
Tragic
41.5%
Somalis
0.0
/100
|
#312
Tragic
41.5%
Jamaicans
0.0
/100
|
#313
Tragic
41.4%
West Indians
0.0
/100
|
#314
Tragic
41.3%