Malaysian vs African Currently Married
COMPARE
Malaysian
African
Currently Married
Currently Married Comparison
Malaysians
Africans
45.9%
CURRENTLY MARRIED
15.3/ 100
METRIC RATING
201st/ 347
METRIC RANK
41.8%
CURRENTLY MARRIED
0.0/ 100
METRIC RATING
307th/ 347
METRIC RANK
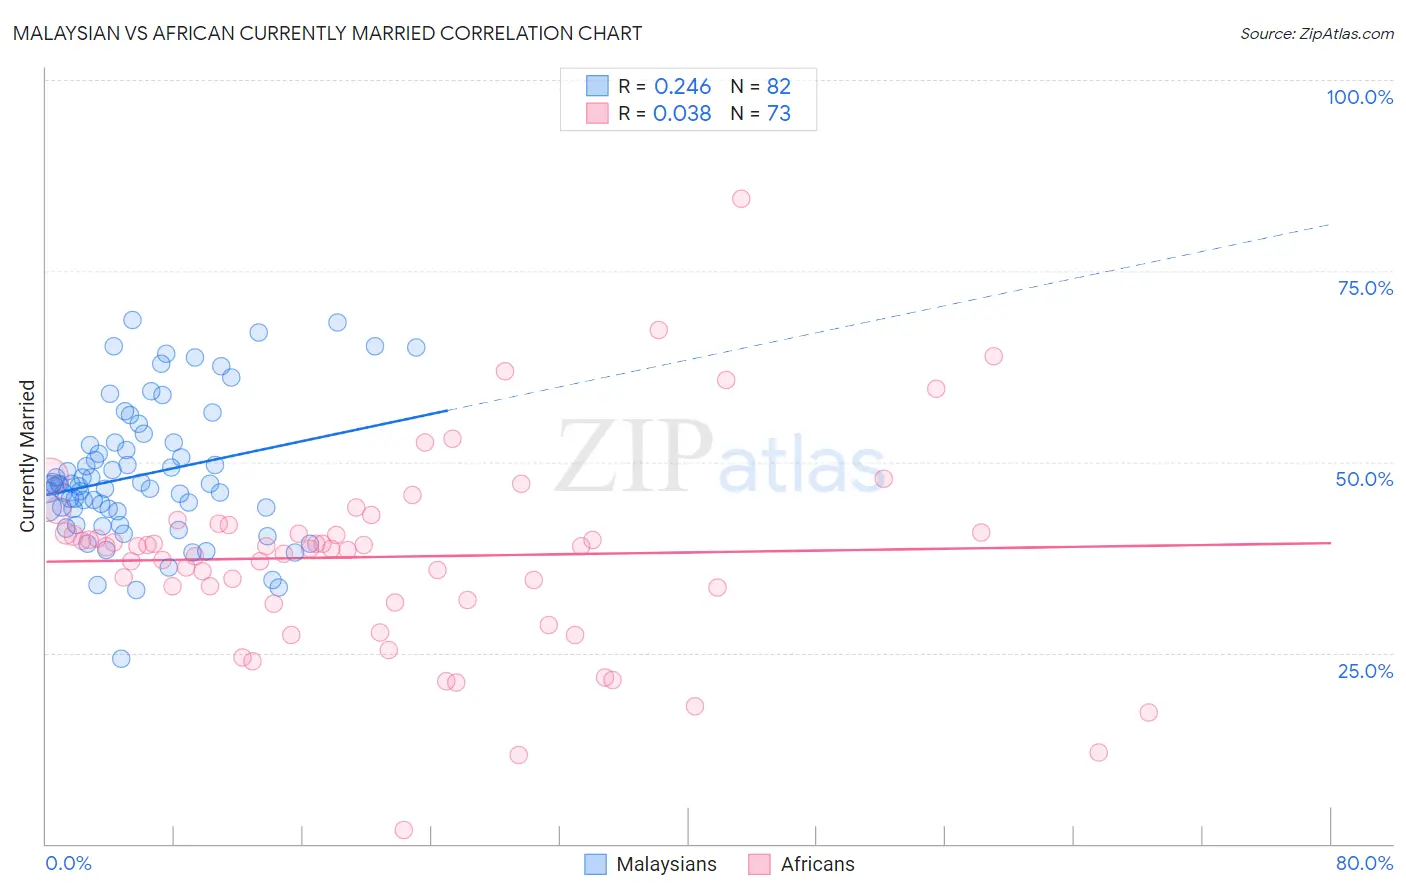
Malaysian vs African Currently Married Correlation Chart
The statistical analysis conducted on geographies consisting of 226,093,582 people shows a weak positive correlation between the proportion of Malaysians and percentage of population currently married in the United States with a correlation coefficient (R) of 0.246 and weighted average of 45.9%. Similarly, the statistical analysis conducted on geographies consisting of 470,023,481 people shows no correlation between the proportion of Africans and percentage of population currently married in the United States with a correlation coefficient (R) of 0.038 and weighted average of 41.8%, a difference of 9.8%.
Currently Married Correlation Summary
| Measurement | Malaysian | African |
| Minimum | 24.3% | 1.8% |
| Maximum | 68.6% | 84.5% |
| Range | 44.3% | 82.7% |
| Mean | 48.3% | 37.6% |
| Median | 46.9% | 38.9% |
| Interquartile 25% (IQ1) | 43.9% | 31.7% |
| Interquartile 75% (IQ3) | 52.6% | 41.2% |
| Interquartile Range (IQR) | 8.7% | 9.4% |
| Standard Deviation (Sample) | 8.9% | 12.9% |
| Standard Deviation (Population) | 8.9% | 12.8% |
Similar Demographics by Currently Married
Demographics Similar to Malaysians by Currently Married
In terms of currently married, the demographic groups most similar to Malaysians are Immigrants from Albania (45.9%, a difference of 0.060%), Creek (46.0%, a difference of 0.13%), Immigrants from Costa Rica (46.0%, a difference of 0.27%), Taiwanese (45.8%, a difference of 0.29%), and Immigrants from Spain (45.8%, a difference of 0.30%).
| Demographics | Rating | Rank | Currently Married |
| South Americans | 23.8 /100 | #194 | Fair 46.1% |
| Immigrants | Nepal | 23.7 /100 | #195 | Fair 46.1% |
| Immigrants | Bosnia and Herzegovina | 22.2 /100 | #196 | Fair 46.1% |
| Immigrants | Kuwait | 21.7 /100 | #197 | Fair 46.1% |
| Immigrants | Colombia | 21.0 /100 | #198 | Fair 46.1% |
| Immigrants | Costa Rica | 19.6 /100 | #199 | Poor 46.0% |
| Creek | 17.2 /100 | #200 | Poor 46.0% |
| Malaysians | 15.3 /100 | #201 | Poor 45.9% |
| Immigrants | Albania | 14.5 /100 | #202 | Poor 45.9% |
| Taiwanese | 11.7 /100 | #203 | Poor 45.8% |
| Immigrants | Spain | 11.6 /100 | #204 | Poor 45.8% |
| South American Indians | 11.5 /100 | #205 | Poor 45.8% |
| Immigrants | Immigrants | 11.2 /100 | #206 | Poor 45.8% |
| Immigrants | South America | 10.8 /100 | #207 | Poor 45.7% |
| Alsatians | 10.8 /100 | #208 | Poor 45.7% |
Demographics Similar to Africans by Currently Married
In terms of currently married, the demographic groups most similar to Africans are Immigrants from Belize (41.8%, a difference of 0.040%), Immigrants from Guyana (41.9%, a difference of 0.13%), Immigrants from Trinidad and Tobago (41.9%, a difference of 0.14%), Immigrants from Liberia (41.8%, a difference of 0.15%), and Immigrants from Bahamas (41.9%, a difference of 0.18%).
| Demographics | Rating | Rank | Currently Married |
| Belizeans | 0.0 /100 | #300 | Tragic 42.2% |
| Immigrants | Yemen | 0.0 /100 | #301 | Tragic 42.1% |
| Immigrants | Zaire | 0.0 /100 | #302 | Tragic 42.0% |
| Sioux | 0.0 /100 | #303 | Tragic 41.9% |
| Immigrants | Bahamas | 0.0 /100 | #304 | Tragic 41.9% |
| Immigrants | Trinidad and Tobago | 0.0 /100 | #305 | Tragic 41.9% |
| Immigrants | Guyana | 0.0 /100 | #306 | Tragic 41.9% |
| Africans | 0.0 /100 | #307 | Tragic 41.8% |
| Immigrants | Belize | 0.0 /100 | #308 | Tragic 41.8% |
| Immigrants | Liberia | 0.0 /100 | #309 | Tragic 41.8% |
| Guyanese | 0.0 /100 | #310 | Tragic 41.6% |
| Trinidadians and Tobagonians | 0.0 /100 | #311 | Tragic 41.5% |
| Somalis | 0.0 /100 | #312 | Tragic 41.5% |
| Jamaicans | 0.0 /100 | #313 | Tragic 41.4% |
| West Indians | 0.0 /100 | #314 | Tragic 41.3% |