Pennsylvania German vs Immigrants from Grenada Births to Unmarried Women
COMPARE
Pennsylvania German
Immigrants from Grenada
Births to Unmarried Women
Births to Unmarried Women Comparison
Pennsylvania Germans
Immigrants from Grenada
34.0%
BIRTHS TO UNMARRIED WOMEN
4.3/ 100
METRIC RATING
223rd/ 347
METRIC RANK
36.3%
BIRTHS TO UNMARRIED WOMEN
0.2/ 100
METRIC RATING
257th/ 347
METRIC RANK
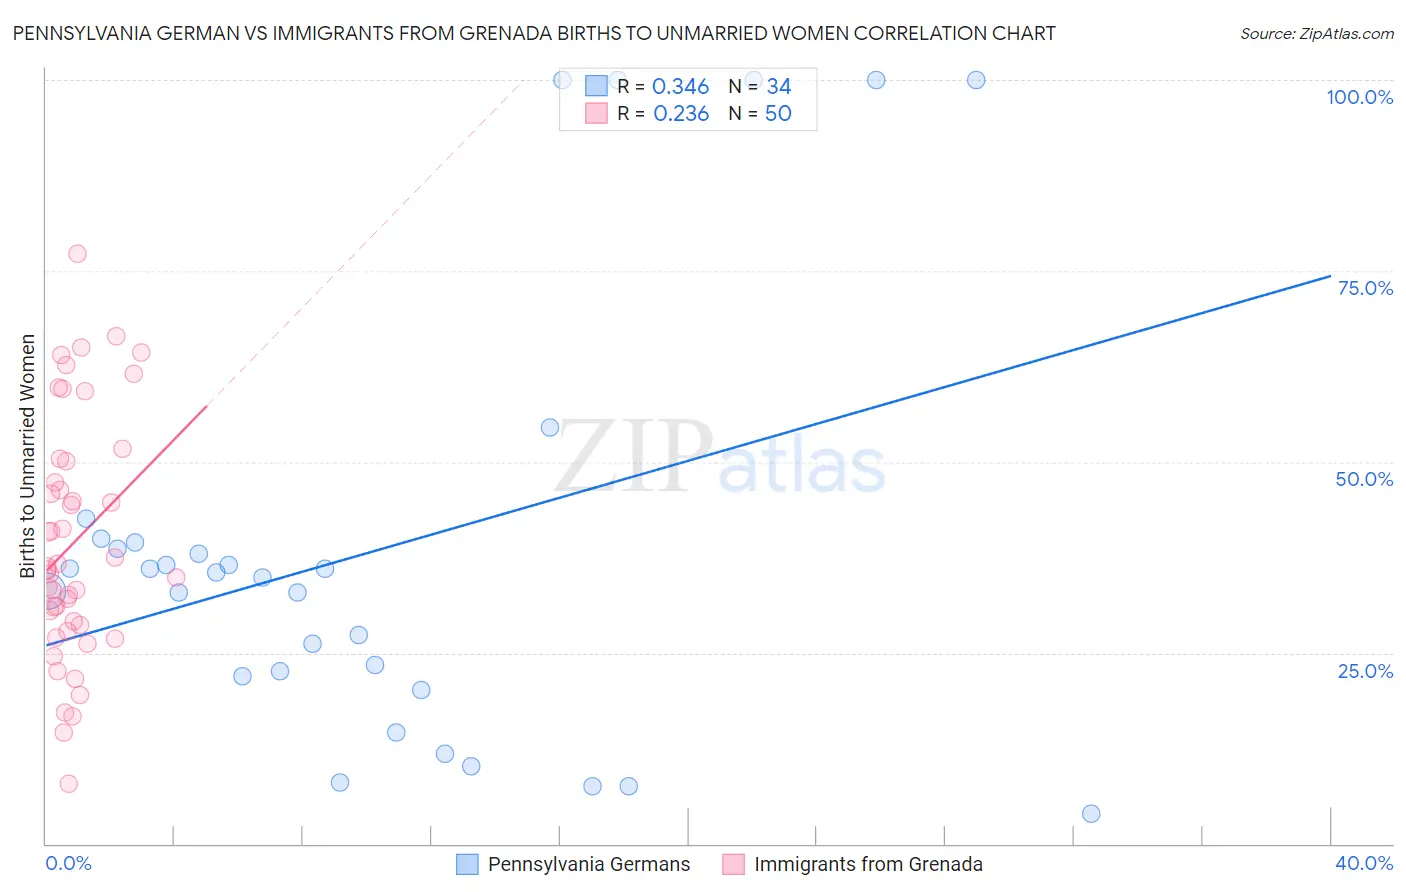
Pennsylvania German vs Immigrants from Grenada Births to Unmarried Women Correlation Chart
The statistical analysis conducted on geographies consisting of 220,469,063 people shows a mild positive correlation between the proportion of Pennsylvania Germans and percentage of births to unmarried women in the United States with a correlation coefficient (R) of 0.346 and weighted average of 34.0%. Similarly, the statistical analysis conducted on geographies consisting of 66,381,769 people shows a weak positive correlation between the proportion of Immigrants from Grenada and percentage of births to unmarried women in the United States with a correlation coefficient (R) of 0.236 and weighted average of 36.3%, a difference of 6.8%.
Births to Unmarried Women Correlation Summary
| Measurement | Pennsylvania German | Immigrants from Grenada |
| Minimum | 4.0% | 7.9% |
| Maximum | 100.0% | 77.2% |
| Range | 96.0% | 69.3% |
| Mean | 38.5% | 39.4% |
| Median | 35.2% | 36.0% |
| Interquartile 25% (IQ1) | 21.9% | 28.6% |
| Interquartile 75% (IQ3) | 39.5% | 50.1% |
| Interquartile Range (IQR) | 17.6% | 21.5% |
| Standard Deviation (Sample) | 28.5% | 15.7% |
| Standard Deviation (Population) | 28.1% | 15.6% |
Similar Demographics by Births to Unmarried Women
Demographics Similar to Pennsylvania Germans by Births to Unmarried Women
In terms of births to unmarried women, the demographic groups most similar to Pennsylvania Germans are Immigrants from Laos (34.0%, a difference of 0.0%), Spanish (34.1%, a difference of 0.17%), Immigrants from Uruguay (33.9%, a difference of 0.29%), Malaysian (33.9%, a difference of 0.35%), and Portuguese (33.8%, a difference of 0.53%).
| Demographics | Rating | Rank | Births to Unmarried Women |
| Nepalese | 7.8 /100 | #216 | Tragic 33.5% |
| Spaniards | 7.0 /100 | #217 | Tragic 33.6% |
| Immigrants | Ecuador | 5.9 /100 | #218 | Tragic 33.7% |
| Alsatians | 5.4 /100 | #219 | Tragic 33.8% |
| Portuguese | 5.4 /100 | #220 | Tragic 33.8% |
| Malaysians | 5.0 /100 | #221 | Tragic 33.9% |
| Immigrants | Uruguay | 4.8 /100 | #222 | Tragic 33.9% |
| Pennsylvania Germans | 4.3 /100 | #223 | Tragic 34.0% |
| Immigrants | Laos | 4.3 /100 | #224 | Tragic 34.0% |
| Spanish | 4.0 /100 | #225 | Tragic 34.1% |
| Delaware | 3.3 /100 | #226 | Tragic 34.2% |
| Immigrants | Panama | 3.3 /100 | #227 | Tragic 34.2% |
| Panamanians | 3.3 /100 | #228 | Tragic 34.2% |
| Immigrants | Sierra Leone | 3.1 /100 | #229 | Tragic 34.2% |
| Ghanaians | 3.1 /100 | #230 | Tragic 34.3% |
Demographics Similar to Immigrants from Grenada by Births to Unmarried Women
In terms of births to unmarried women, the demographic groups most similar to Immigrants from Grenada are Chickasaw (36.3%, a difference of 0.030%), Immigrants from Trinidad and Tobago (36.3%, a difference of 0.030%), Potawatomi (36.2%, a difference of 0.16%), American (36.4%, a difference of 0.28%), and Immigrants from El Salvador (36.4%, a difference of 0.33%).
| Demographics | Rating | Rank | Births to Unmarried Women |
| Mexican American Indians | 0.4 /100 | #250 | Tragic 35.7% |
| Immigrants | Western Africa | 0.3 /100 | #251 | Tragic 36.0% |
| Salvadorans | 0.3 /100 | #252 | Tragic 36.0% |
| Immigrants | Portugal | 0.2 /100 | #253 | Tragic 36.2% |
| Potawatomi | 0.2 /100 | #254 | Tragic 36.2% |
| Chickasaw | 0.2 /100 | #255 | Tragic 36.3% |
| Immigrants | Trinidad and Tobago | 0.2 /100 | #256 | Tragic 36.3% |
| Immigrants | Grenada | 0.2 /100 | #257 | Tragic 36.3% |
| Americans | 0.2 /100 | #258 | Tragic 36.4% |
| Immigrants | El Salvador | 0.2 /100 | #259 | Tragic 36.4% |
| Ottawa | 0.2 /100 | #260 | Tragic 36.5% |
| Trinidadians and Tobagonians | 0.2 /100 | #261 | Tragic 36.5% |
| French American Indians | 0.1 /100 | #262 | Tragic 36.6% |
| Nicaraguans | 0.1 /100 | #263 | Tragic 36.6% |
| Sub-Saharan Africans | 0.1 /100 | #264 | Tragic 36.7% |