Pennsylvania German vs Immigrants from Belarus Births to Unmarried Women
COMPARE
Pennsylvania German
Immigrants from Belarus
Births to Unmarried Women
Births to Unmarried Women Comparison
Pennsylvania Germans
Immigrants from Belarus
34.0%
BIRTHS TO UNMARRIED WOMEN
4.3/ 100
METRIC RATING
223rd/ 347
METRIC RANK
25.6%
BIRTHS TO UNMARRIED WOMEN
100.0/ 100
METRIC RATING
16th/ 347
METRIC RANK
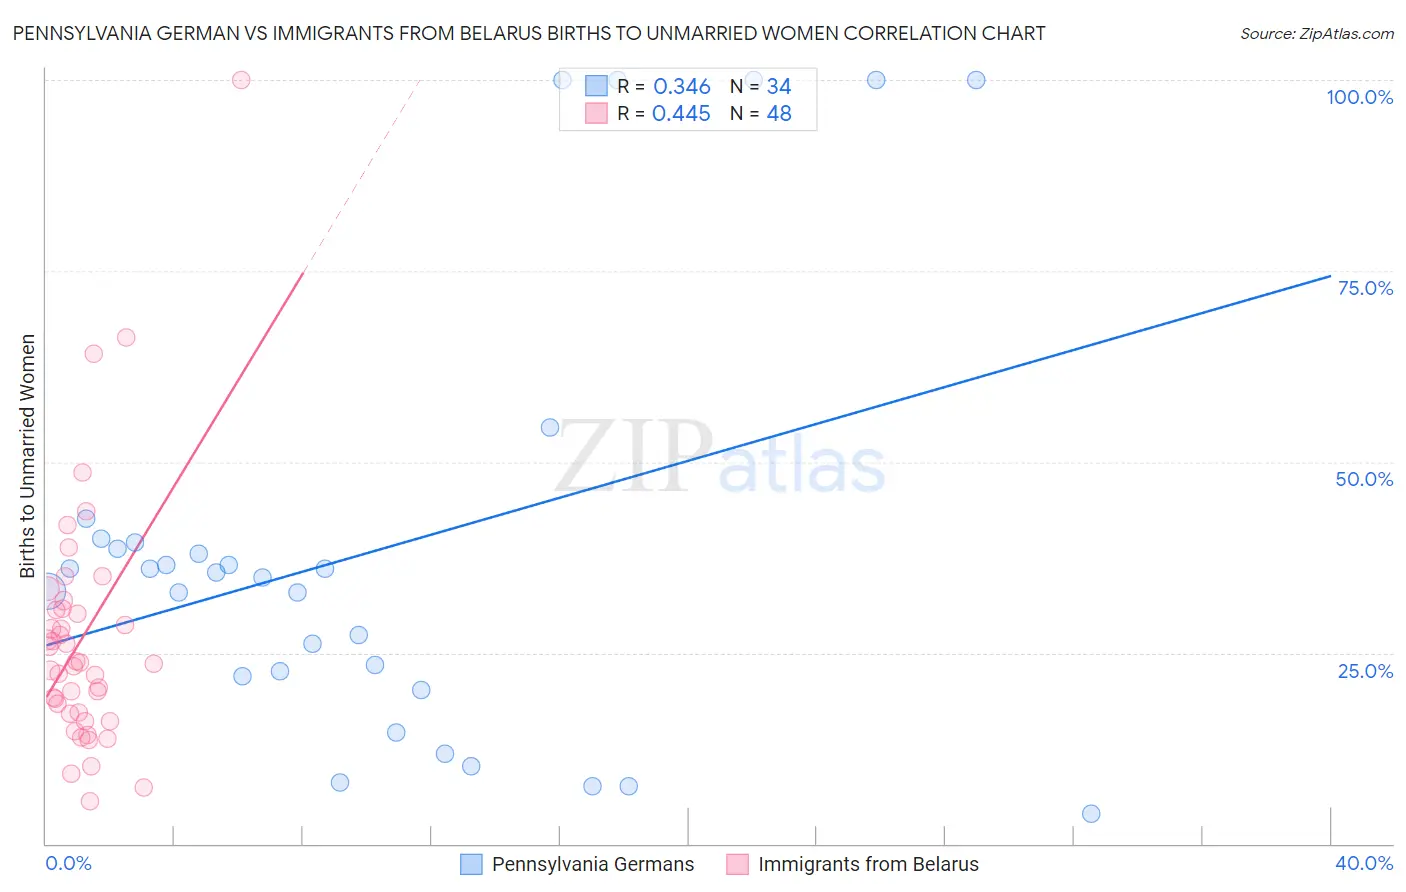
Pennsylvania German vs Immigrants from Belarus Births to Unmarried Women Correlation Chart
The statistical analysis conducted on geographies consisting of 220,469,063 people shows a mild positive correlation between the proportion of Pennsylvania Germans and percentage of births to unmarried women in the United States with a correlation coefficient (R) of 0.346 and weighted average of 34.0%. Similarly, the statistical analysis conducted on geographies consisting of 142,991,373 people shows a moderate positive correlation between the proportion of Immigrants from Belarus and percentage of births to unmarried women in the United States with a correlation coefficient (R) of 0.445 and weighted average of 25.6%, a difference of 32.6%.
Births to Unmarried Women Correlation Summary
| Measurement | Pennsylvania German | Immigrants from Belarus |
| Minimum | 4.0% | 5.6% |
| Maximum | 100.0% | 100.0% |
| Range | 96.0% | 94.4% |
| Mean | 38.5% | 27.0% |
| Median | 35.2% | 23.7% |
| Interquartile 25% (IQ1) | 21.9% | 17.1% |
| Interquartile 75% (IQ3) | 39.5% | 30.7% |
| Interquartile Range (IQR) | 17.6% | 13.5% |
| Standard Deviation (Sample) | 28.5% | 16.5% |
| Standard Deviation (Population) | 28.1% | 16.3% |
Similar Demographics by Births to Unmarried Women
Demographics Similar to Pennsylvania Germans by Births to Unmarried Women
In terms of births to unmarried women, the demographic groups most similar to Pennsylvania Germans are Immigrants from Laos (34.0%, a difference of 0.0%), Spanish (34.1%, a difference of 0.17%), Immigrants from Uruguay (33.9%, a difference of 0.29%), Malaysian (33.9%, a difference of 0.35%), and Portuguese (33.8%, a difference of 0.53%).
| Demographics | Rating | Rank | Births to Unmarried Women |
| Nepalese | 7.8 /100 | #216 | Tragic 33.5% |
| Spaniards | 7.0 /100 | #217 | Tragic 33.6% |
| Immigrants | Ecuador | 5.9 /100 | #218 | Tragic 33.7% |
| Alsatians | 5.4 /100 | #219 | Tragic 33.8% |
| Portuguese | 5.4 /100 | #220 | Tragic 33.8% |
| Malaysians | 5.0 /100 | #221 | Tragic 33.9% |
| Immigrants | Uruguay | 4.8 /100 | #222 | Tragic 33.9% |
| Pennsylvania Germans | 4.3 /100 | #223 | Tragic 34.0% |
| Immigrants | Laos | 4.3 /100 | #224 | Tragic 34.0% |
| Spanish | 4.0 /100 | #225 | Tragic 34.1% |
| Delaware | 3.3 /100 | #226 | Tragic 34.2% |
| Immigrants | Panama | 3.3 /100 | #227 | Tragic 34.2% |
| Panamanians | 3.3 /100 | #228 | Tragic 34.2% |
| Immigrants | Sierra Leone | 3.1 /100 | #229 | Tragic 34.2% |
| Ghanaians | 3.1 /100 | #230 | Tragic 34.3% |
Demographics Similar to Immigrants from Belarus by Births to Unmarried Women
In terms of births to unmarried women, the demographic groups most similar to Immigrants from Belarus are Immigrants from Singapore (25.6%, a difference of 0.050%), Immigrants from Uzbekistan (25.8%, a difference of 0.57%), Immigrants from Lebanon (25.3%, a difference of 1.2%), Iranian (25.3%, a difference of 1.3%), and Indian (Asian) (25.3%, a difference of 1.5%).
| Demographics | Rating | Rank | Births to Unmarried Women |
| Immigrants | South Central Asia | 100.0 /100 | #9 | Exceptional 24.7% |
| Immigrants | Eastern Asia | 100.0 /100 | #10 | Exceptional 25.0% |
| Immigrants | Israel | 100.0 /100 | #11 | Exceptional 25.1% |
| Indians (Asian) | 100.0 /100 | #12 | Exceptional 25.3% |
| Iranians | 100.0 /100 | #13 | Exceptional 25.3% |
| Immigrants | Lebanon | 100.0 /100 | #14 | Exceptional 25.3% |
| Immigrants | Singapore | 100.0 /100 | #15 | Exceptional 25.6% |
| Immigrants | Belarus | 100.0 /100 | #16 | Exceptional 25.6% |
| Immigrants | Uzbekistan | 100.0 /100 | #17 | Exceptional 25.8% |
| Immigrants | Armenia | 99.9 /100 | #18 | Exceptional 26.1% |
| Armenians | 99.9 /100 | #19 | Exceptional 26.2% |
| Immigrants | Korea | 99.9 /100 | #20 | Exceptional 26.3% |
| Soviet Union | 99.9 /100 | #21 | Exceptional 26.3% |
| Burmese | 99.9 /100 | #22 | Exceptional 26.4% |
| Immigrants | Japan | 99.9 /100 | #23 | Exceptional 26.4% |