Paraguayan vs Puget Sound Salish 5th Grade
COMPARE
Paraguayan
Puget Sound Salish
5th Grade
5th Grade Comparison
Paraguayans
Puget Sound Salish
97.3%
5TH GRADE
33.7/ 100
METRIC RATING
188th/ 347
METRIC RANK
97.7%
5TH GRADE
98.3/ 100
METRIC RATING
100th/ 347
METRIC RANK
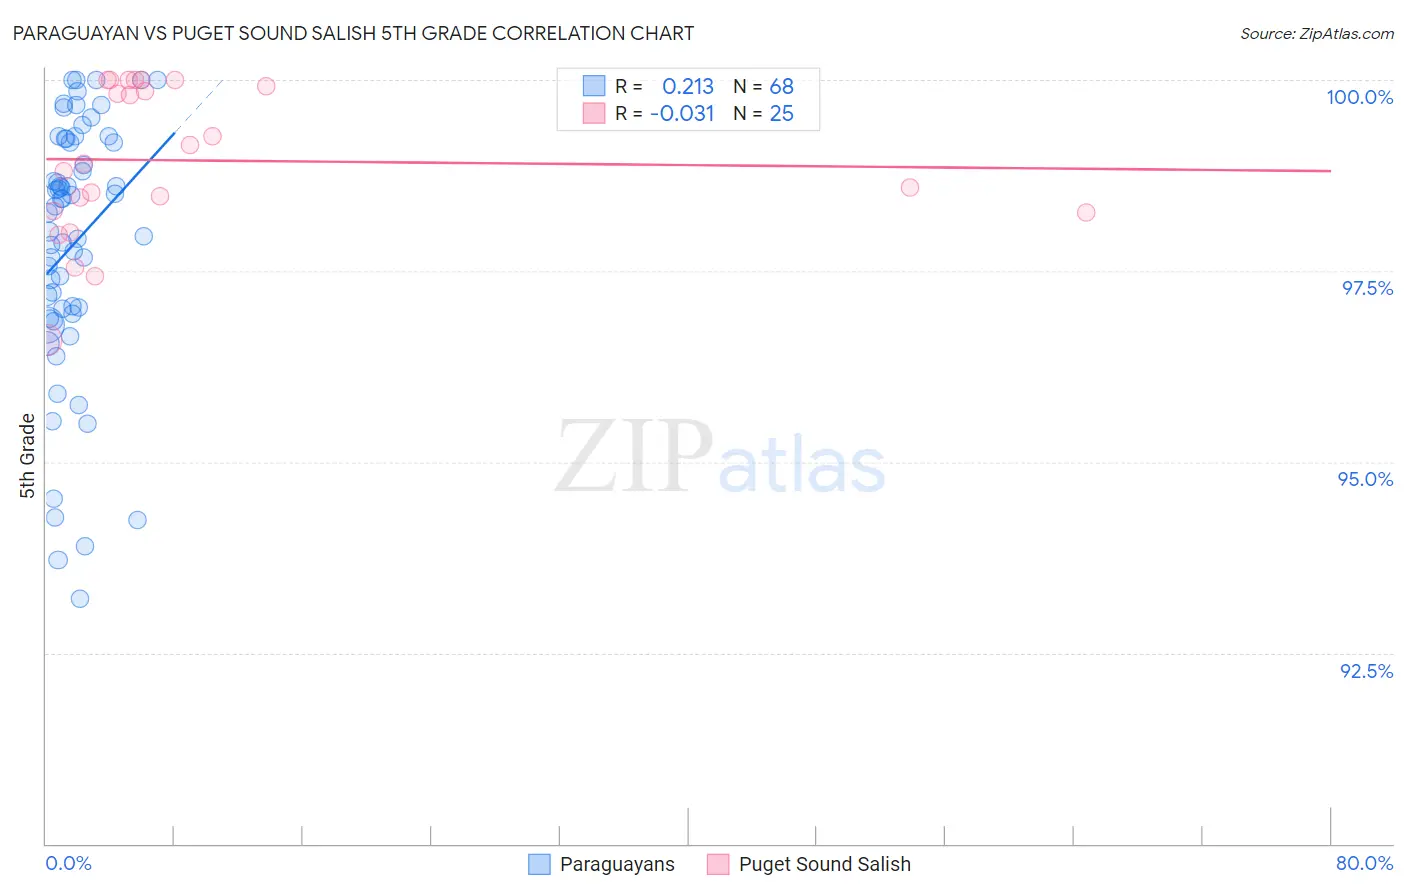
Paraguayan vs Puget Sound Salish 5th Grade Correlation Chart
The statistical analysis conducted on geographies consisting of 95,115,093 people shows a weak positive correlation between the proportion of Paraguayans and percentage of population with at least 5th grade education in the United States with a correlation coefficient (R) of 0.213 and weighted average of 97.3%. Similarly, the statistical analysis conducted on geographies consisting of 46,155,746 people shows no correlation between the proportion of Puget Sound Salish and percentage of population with at least 5th grade education in the United States with a correlation coefficient (R) of -0.031 and weighted average of 97.7%, a difference of 0.49%.
5th Grade Correlation Summary
| Measurement | Paraguayan | Puget Sound Salish |
| Minimum | 93.2% | 96.6% |
| Maximum | 100.0% | 100.0% |
| Range | 6.8% | 3.4% |
| Mean | 97.8% | 98.9% |
| Median | 98.3% | 98.9% |
| Interquartile 25% (IQ1) | 97.0% | 98.3% |
| Interquartile 75% (IQ3) | 99.2% | 100.0% |
| Interquartile Range (IQR) | 2.2% | 1.7% |
| Standard Deviation (Sample) | 1.7% | 0.99% |
| Standard Deviation (Population) | 1.7% | 0.97% |
Similar Demographics by 5th Grade
Demographics Similar to Paraguayans by 5th Grade
In terms of 5th grade, the demographic groups most similar to Paraguayans are Spanish American (97.3%, a difference of 0.0%), Immigrants from Egypt (97.3%, a difference of 0.0%), Dutch West Indian (97.3%, a difference of 0.010%), Immigrants from Argentina (97.3%, a difference of 0.010%), and Black/African American (97.3%, a difference of 0.010%).
| Demographics | Rating | Rank | 5th Grade |
| Argentineans | 39.5 /100 | #181 | Fair 97.3% |
| Mongolians | 39.4 /100 | #182 | Fair 97.3% |
| Immigrants | Ukraine | 38.6 /100 | #183 | Fair 97.3% |
| Immigrants | Venezuela | 38.4 /100 | #184 | Fair 97.3% |
| Dutch West Indians | 36.2 /100 | #185 | Fair 97.3% |
| Immigrants | Argentina | 36.1 /100 | #186 | Fair 97.3% |
| Spanish Americans | 34.7 /100 | #187 | Fair 97.3% |
| Paraguayans | 33.7 /100 | #188 | Fair 97.3% |
| Immigrants | Egypt | 32.9 /100 | #189 | Fair 97.3% |
| Blacks/African Americans | 31.8 /100 | #190 | Fair 97.3% |
| Immigrants | Brazil | 31.5 /100 | #191 | Fair 97.3% |
| Panamanians | 31.3 /100 | #192 | Fair 97.3% |
| Navajo | 29.0 /100 | #193 | Fair 97.2% |
| Immigrants | Albania | 28.5 /100 | #194 | Fair 97.2% |
| Guamanians/Chamorros | 26.8 /100 | #195 | Fair 97.2% |
Demographics Similar to Puget Sound Salish by 5th Grade
In terms of 5th grade, the demographic groups most similar to Puget Sound Salish are Yugoslavian (97.7%, a difference of 0.0%), Turkish (97.7%, a difference of 0.0%), South African (97.7%, a difference of 0.0%), Cree (97.7%, a difference of 0.010%), and Delaware (97.8%, a difference of 0.020%).
| Demographics | Rating | Rank | 5th Grade |
| Delaware | 98.6 /100 | #93 | Exceptional 97.8% |
| Immigrants | Denmark | 98.6 /100 | #94 | Exceptional 97.8% |
| Romanians | 98.6 /100 | #95 | Exceptional 97.8% |
| Immigrants | Germany | 98.5 /100 | #96 | Exceptional 97.8% |
| Cree | 98.4 /100 | #97 | Exceptional 97.7% |
| Yugoslavians | 98.3 /100 | #98 | Exceptional 97.7% |
| Turks | 98.3 /100 | #99 | Exceptional 97.7% |
| Puget Sound Salish | 98.3 /100 | #100 | Exceptional 97.7% |
| South Africans | 98.3 /100 | #101 | Exceptional 97.7% |
| Choctaw | 98.0 /100 | #102 | Exceptional 97.7% |
| Cheyenne | 97.9 /100 | #103 | Exceptional 97.7% |
| German Russians | 97.8 /100 | #104 | Exceptional 97.7% |
| Bhutanese | 97.6 /100 | #105 | Exceptional 97.7% |
| Immigrants | Czechoslovakia | 97.5 /100 | #106 | Exceptional 97.7% |
| Immigrants | Singapore | 97.5 /100 | #107 | Exceptional 97.7% |