Australian vs Puget Sound Salish Currently Married
COMPARE
Australian
Puget Sound Salish
Currently Married
Currently Married Comparison
Australians
Puget Sound Salish
47.6%
CURRENTLY MARRIED
90.2/ 100
METRIC RATING
119th/ 347
METRIC RANK
47.6%
CURRENTLY MARRIED
90.3/ 100
METRIC RATING
117th/ 347
METRIC RANK
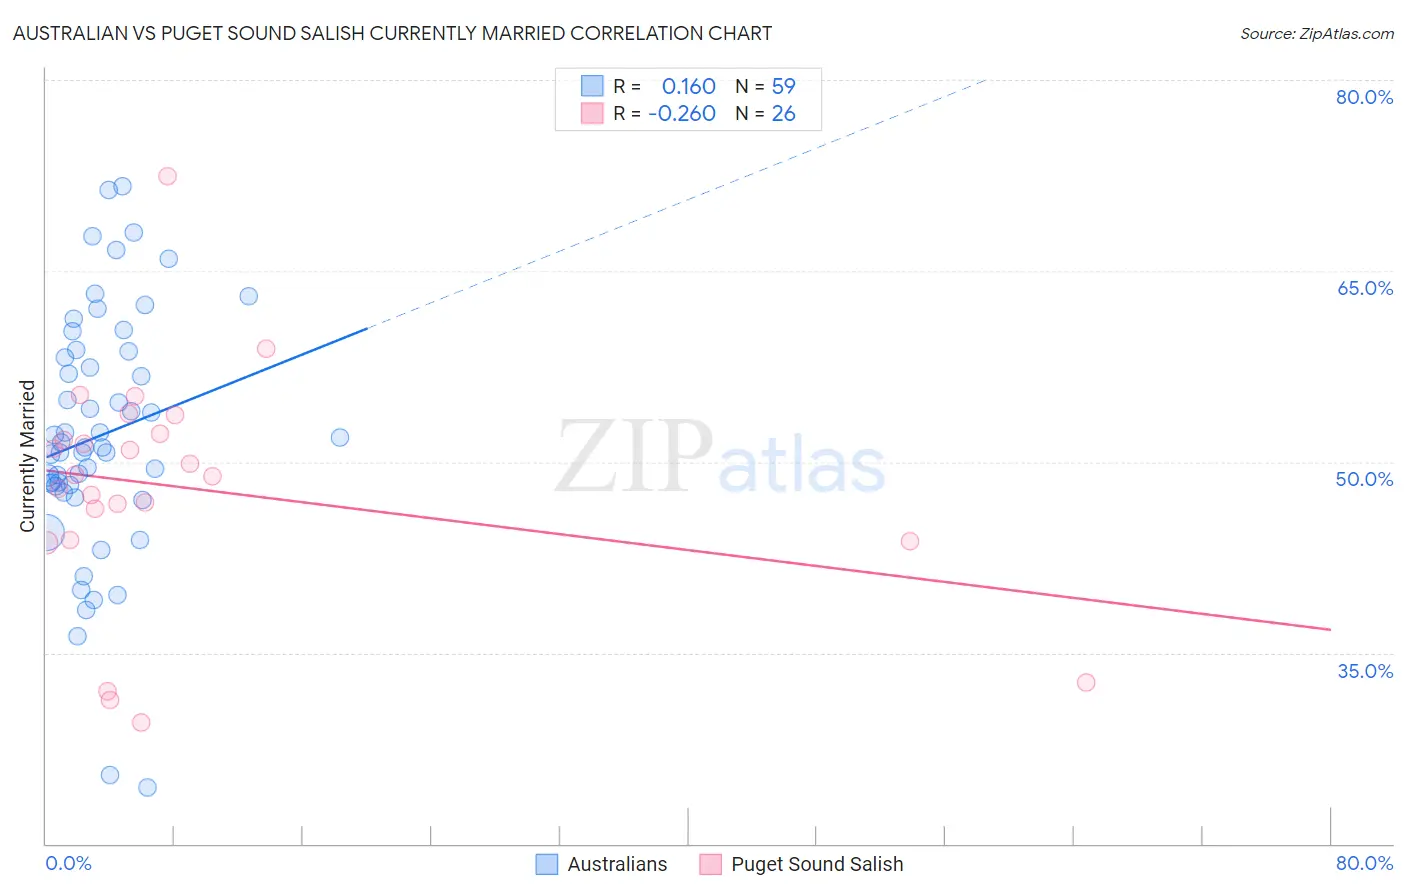
Australian vs Puget Sound Salish Currently Married Correlation Chart
The statistical analysis conducted on geographies consisting of 224,121,967 people shows a poor positive correlation between the proportion of Australians and percentage of population currently married in the United States with a correlation coefficient (R) of 0.160 and weighted average of 47.6%. Similarly, the statistical analysis conducted on geographies consisting of 46,155,865 people shows a weak negative correlation between the proportion of Puget Sound Salish and percentage of population currently married in the United States with a correlation coefficient (R) of -0.260 and weighted average of 47.6%, a difference of 0.010%.
Currently Married Correlation Summary
| Measurement | Australian | Puget Sound Salish |
| Minimum | 24.4% | 29.5% |
| Maximum | 71.6% | 72.4% |
| Range | 47.2% | 42.9% |
| Mean | 52.1% | 47.9% |
| Median | 51.2% | 48.9% |
| Interquartile 25% (IQ1) | 48.1% | 43.9% |
| Interquartile 75% (IQ3) | 58.6% | 52.2% |
| Interquartile Range (IQR) | 10.6% | 8.3% |
| Standard Deviation (Sample) | 9.7% | 9.2% |
| Standard Deviation (Population) | 9.6% | 9.0% |
Demographics Similar to Australians and Puget Sound Salish by Currently Married
In terms of currently married, the demographic groups most similar to Australians are Immigrants from Philippines (47.6%, a difference of 0.0%), Palestinian (47.6%, a difference of 0.020%), Immigrants from Indonesia (47.6%, a difference of 0.030%), South African (47.6%, a difference of 0.040%), and Immigrants from Denmark (47.6%, a difference of 0.070%). Similarly, the demographic groups most similar to Puget Sound Salish are Immigrants from Philippines (47.6%, a difference of 0.010%), Immigrants from Indonesia (47.6%, a difference of 0.020%), Palestinian (47.6%, a difference of 0.020%), South African (47.6%, a difference of 0.030%), and Immigrants from Denmark (47.6%, a difference of 0.060%).
| Demographics | Rating | Rank | Currently Married |
| Tsimshian | 92.4 /100 | #108 | Exceptional 47.7% |
| Immigrants | Egypt | 92.3 /100 | #109 | Exceptional 47.7% |
| Immigrants | Russia | 92.0 /100 | #110 | Exceptional 47.7% |
| Immigrants | Hungary | 91.2 /100 | #111 | Exceptional 47.6% |
| Immigrants | Western Europe | 91.1 /100 | #112 | Exceptional 47.6% |
| Immigrants | Denmark | 90.9 /100 | #113 | Exceptional 47.6% |
| South Africans | 90.5 /100 | #114 | Exceptional 47.6% |
| Immigrants | Indonesia | 90.5 /100 | #115 | Exceptional 47.6% |
| Palestinians | 90.4 /100 | #116 | Exceptional 47.6% |
| Puget Sound Salish | 90.3 /100 | #117 | Exceptional 47.6% |
| Immigrants | Philippines | 90.2 /100 | #118 | Exceptional 47.6% |
| Australians | 90.2 /100 | #119 | Exceptional 47.6% |
| Syrians | 88.9 /100 | #120 | Excellent 47.5% |
| Immigrants | Croatia | 88.6 /100 | #121 | Excellent 47.5% |
| Osage | 87.9 /100 | #122 | Excellent 47.5% |
| Immigrants | Kazakhstan | 87.2 /100 | #123 | Excellent 47.4% |
| Laotians | 86.6 /100 | #124 | Excellent 47.4% |
| Okinawans | 85.3 /100 | #125 | Excellent 47.4% |
| Immigrants | Jordan | 84.9 /100 | #126 | Excellent 47.4% |
| New Zealanders | 84.9 /100 | #127 | Excellent 47.4% |
| Portuguese | 84.2 /100 | #128 | Excellent 47.3% |