Immigrants from Sweden vs Puget Sound Salish Currently Married
COMPARE
Immigrants from Sweden
Puget Sound Salish
Currently Married
Currently Married Comparison
Immigrants from Sweden
Puget Sound Salish
47.8%
CURRENTLY MARRIED
94.3/ 100
METRIC RATING
99th/ 347
METRIC RANK
47.6%
CURRENTLY MARRIED
90.3/ 100
METRIC RATING
117th/ 347
METRIC RANK
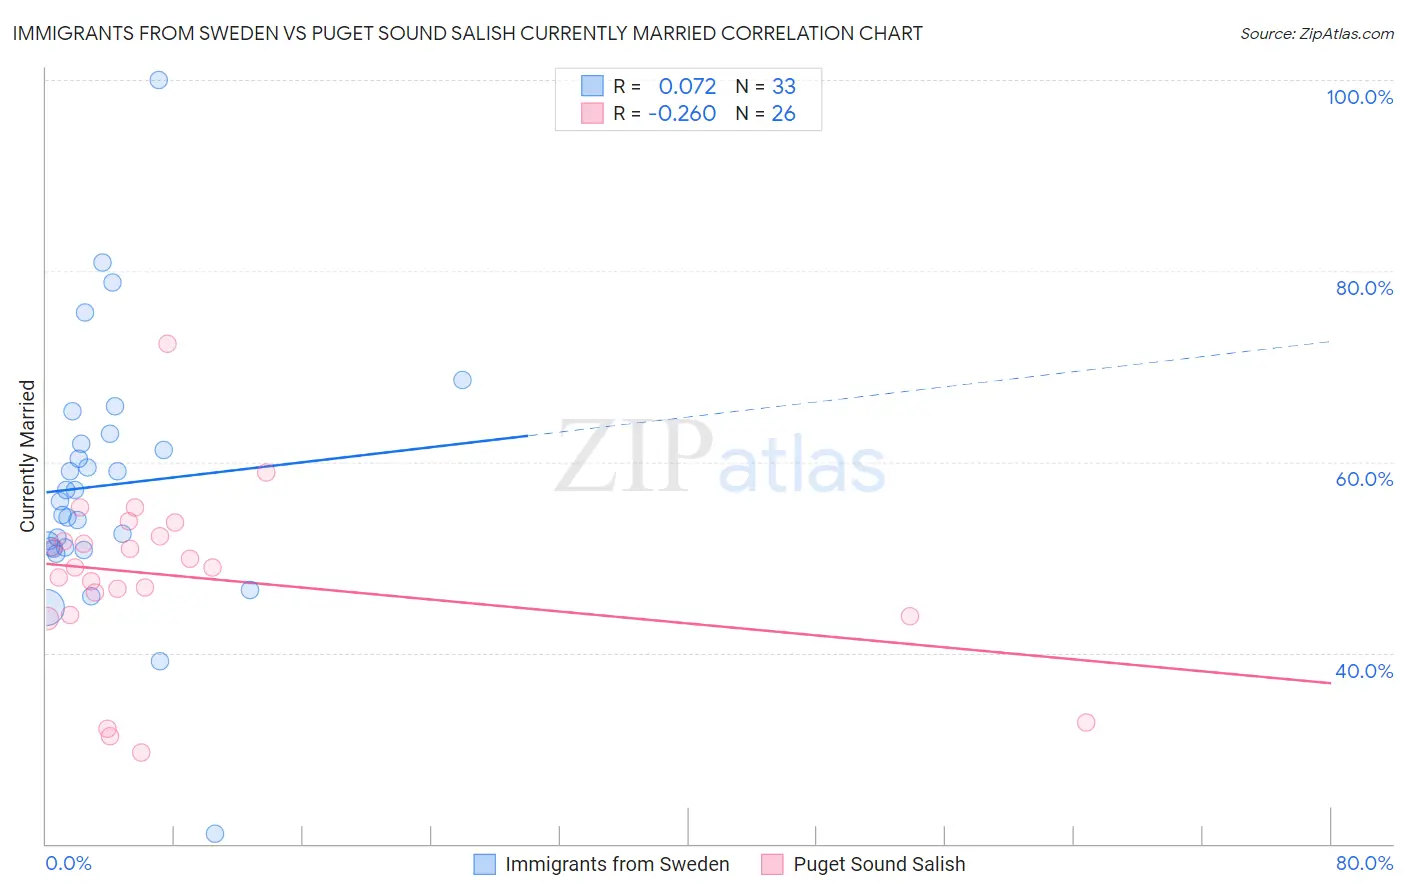
Immigrants from Sweden vs Puget Sound Salish Currently Married Correlation Chart
The statistical analysis conducted on geographies consisting of 164,728,408 people shows a slight positive correlation between the proportion of Immigrants from Sweden and percentage of population currently married in the United States with a correlation coefficient (R) of 0.072 and weighted average of 47.8%. Similarly, the statistical analysis conducted on geographies consisting of 46,155,865 people shows a weak negative correlation between the proportion of Puget Sound Salish and percentage of population currently married in the United States with a correlation coefficient (R) of -0.260 and weighted average of 47.6%, a difference of 0.51%.
Currently Married Correlation Summary
| Measurement | Immigrants from Sweden | Puget Sound Salish |
| Minimum | 21.1% | 29.5% |
| Maximum | 100.0% | 72.4% |
| Range | 78.9% | 42.9% |
| Mean | 57.6% | 47.9% |
| Median | 55.9% | 48.9% |
| Interquartile 25% (IQ1) | 51.0% | 43.9% |
| Interquartile 75% (IQ3) | 62.4% | 52.2% |
| Interquartile Range (IQR) | 11.5% | 8.3% |
| Standard Deviation (Sample) | 13.6% | 9.2% |
| Standard Deviation (Population) | 13.4% | 9.0% |
Demographics Similar to Immigrants from Sweden and Puget Sound Salish by Currently Married
In terms of currently married, the demographic groups most similar to Immigrants from Sweden are Celtic (47.8%, a difference of 0.020%), Immigrants from Germany (47.8%, a difference of 0.040%), Turkish (47.8%, a difference of 0.060%), Immigrants from China (47.9%, a difference of 0.080%), and Cypriot (47.8%, a difference of 0.090%). Similarly, the demographic groups most similar to Puget Sound Salish are Immigrants from Philippines (47.6%, a difference of 0.010%), Immigrants from Indonesia (47.6%, a difference of 0.020%), Palestinian (47.6%, a difference of 0.020%), South African (47.6%, a difference of 0.030%), and Immigrants from Denmark (47.6%, a difference of 0.060%).
| Demographics | Rating | Rank | Currently Married |
| Immigrants | China | 94.7 /100 | #98 | Exceptional 47.9% |
| Immigrants | Sweden | 94.3 /100 | #99 | Exceptional 47.8% |
| Celtics | 94.2 /100 | #100 | Exceptional 47.8% |
| Immigrants | Germany | 94.1 /100 | #101 | Exceptional 47.8% |
| Turks | 93.9 /100 | #102 | Exceptional 47.8% |
| Cypriots | 93.7 /100 | #103 | Exceptional 47.8% |
| Serbians | 93.6 /100 | #104 | Exceptional 47.8% |
| Immigrants | Singapore | 93.3 /100 | #105 | Exceptional 47.8% |
| Immigrants | Greece | 93.1 /100 | #106 | Exceptional 47.7% |
| Immigrants | Italy | 92.9 /100 | #107 | Exceptional 47.7% |
| Tsimshian | 92.4 /100 | #108 | Exceptional 47.7% |
| Immigrants | Egypt | 92.3 /100 | #109 | Exceptional 47.7% |
| Immigrants | Russia | 92.0 /100 | #110 | Exceptional 47.7% |
| Immigrants | Hungary | 91.2 /100 | #111 | Exceptional 47.6% |
| Immigrants | Western Europe | 91.1 /100 | #112 | Exceptional 47.6% |
| Immigrants | Denmark | 90.9 /100 | #113 | Exceptional 47.6% |
| South Africans | 90.5 /100 | #114 | Exceptional 47.6% |
| Immigrants | Indonesia | 90.5 /100 | #115 | Exceptional 47.6% |
| Palestinians | 90.4 /100 | #116 | Exceptional 47.6% |
| Puget Sound Salish | 90.3 /100 | #117 | Exceptional 47.6% |
| Immigrants | Philippines | 90.2 /100 | #118 | Exceptional 47.6% |