Paiute vs Salvadoran Births to Unmarried Women
COMPARE
Paiute
Salvadoran
Births to Unmarried Women
Births to Unmarried Women Comparison
Paiute
Salvadorans
42.5%
BIRTHS TO UNMARRIED WOMEN
0.0/ 100
METRIC RATING
329th/ 347
METRIC RANK
36.0%
BIRTHS TO UNMARRIED WOMEN
0.3/ 100
METRIC RATING
252nd/ 347
METRIC RANK
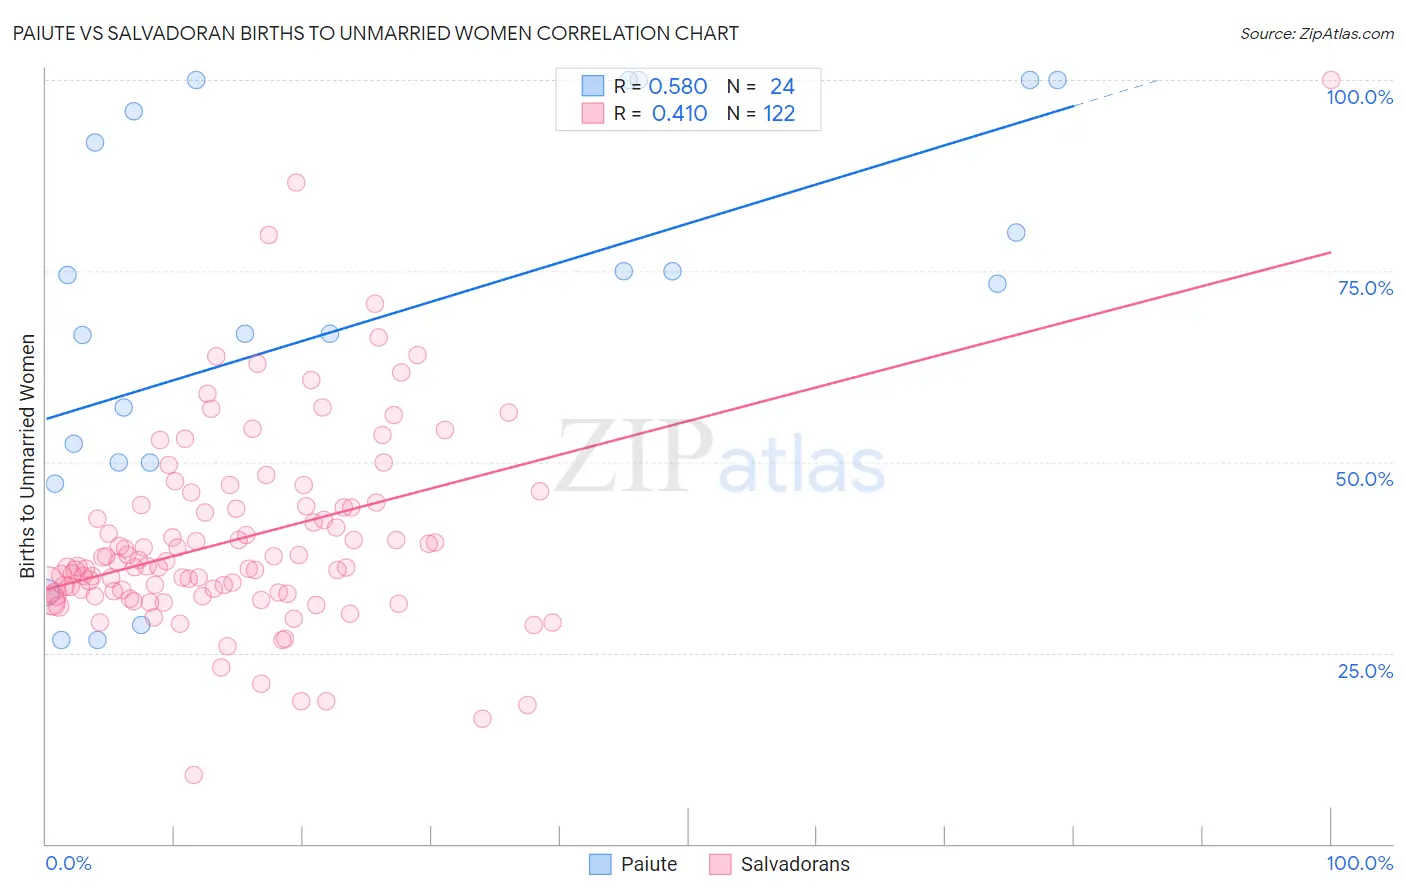
Paiute vs Salvadoran Births to Unmarried Women Correlation Chart
The statistical analysis conducted on geographies consisting of 57,331,640 people shows a substantial positive correlation between the proportion of Paiute and percentage of births to unmarried women in the United States with a correlation coefficient (R) of 0.580 and weighted average of 42.5%. Similarly, the statistical analysis conducted on geographies consisting of 377,312,875 people shows a moderate positive correlation between the proportion of Salvadorans and percentage of births to unmarried women in the United States with a correlation coefficient (R) of 0.410 and weighted average of 36.0%, a difference of 18.0%.
Births to Unmarried Women Correlation Summary
| Measurement | Paiute | Salvadoran |
| Minimum | 26.6% | 9.0% |
| Maximum | 100.0% | 100.0% |
| Range | 73.4% | 91.0% |
| Mean | 68.2% | 40.0% |
| Median | 70.0% | 36.3% |
| Interquartile 25% (IQ1) | 50.0% | 32.7% |
| Interquartile 75% (IQ3) | 93.9% | 44.2% |
| Interquartile Range (IQR) | 43.9% | 11.5% |
| Standard Deviation (Sample) | 25.1% | 13.3% |
| Standard Deviation (Population) | 24.5% | 13.2% |
Similar Demographics by Births to Unmarried Women
Demographics Similar to Paiute by Births to Unmarried Women
In terms of births to unmarried women, the demographic groups most similar to Paiute are Chippewa (42.6%, a difference of 0.40%), Immigrants from Cabo Verde (42.2%, a difference of 0.60%), Tsimshian (42.2%, a difference of 0.74%), Native/Alaskan (43.0%, a difference of 1.2%), and Kiowa (43.1%, a difference of 1.6%).
| Demographics | Rating | Rank | Births to Unmarried Women |
| Cajuns | 0.0 /100 | #322 | Tragic 41.0% |
| Sioux | 0.0 /100 | #323 | Tragic 41.0% |
| Cape Verdeans | 0.0 /100 | #324 | Tragic 41.3% |
| Cheyenne | 0.0 /100 | #325 | Tragic 41.3% |
| Immigrants | Cuba | 0.0 /100 | #326 | Tragic 41.5% |
| Tsimshian | 0.0 /100 | #327 | Tragic 42.2% |
| Immigrants | Cabo Verde | 0.0 /100 | #328 | Tragic 42.2% |
| Paiute | 0.0 /100 | #329 | Tragic 42.5% |
| Chippewa | 0.0 /100 | #330 | Tragic 42.6% |
| Natives/Alaskans | 0.0 /100 | #331 | Tragic 43.0% |
| Kiowa | 0.0 /100 | #332 | Tragic 43.1% |
| Blacks/African Americans | 0.0 /100 | #333 | Tragic 44.3% |
| Yuman | 0.0 /100 | #334 | Tragic 44.4% |
| Colville | 0.0 /100 | #335 | Tragic 45.3% |
| Puerto Ricans | 0.0 /100 | #336 | Tragic 45.7% |
Demographics Similar to Salvadorans by Births to Unmarried Women
In terms of births to unmarried women, the demographic groups most similar to Salvadorans are Immigrants from Western Africa (36.0%, a difference of 0.12%), Immigrants from Portugal (36.2%, a difference of 0.46%), Potawatomi (36.2%, a difference of 0.68%), Mexican American Indian (35.7%, a difference of 0.69%), and Chickasaw (36.3%, a difference of 0.82%).
| Demographics | Rating | Rank | Births to Unmarried Women |
| Shoshone | 0.8 /100 | #245 | Tragic 35.3% |
| Nigerians | 0.7 /100 | #246 | Tragic 35.3% |
| Immigrants | Nigeria | 0.7 /100 | #247 | Tragic 35.4% |
| Immigrants | Nonimmigrants | 0.6 /100 | #248 | Tragic 35.5% |
| Bermudans | 0.6 /100 | #249 | Tragic 35.5% |
| Mexican American Indians | 0.4 /100 | #250 | Tragic 35.7% |
| Immigrants | Western Africa | 0.3 /100 | #251 | Tragic 36.0% |
| Salvadorans | 0.3 /100 | #252 | Tragic 36.0% |
| Immigrants | Portugal | 0.2 /100 | #253 | Tragic 36.2% |
| Potawatomi | 0.2 /100 | #254 | Tragic 36.2% |
| Chickasaw | 0.2 /100 | #255 | Tragic 36.3% |
| Immigrants | Trinidad and Tobago | 0.2 /100 | #256 | Tragic 36.3% |
| Immigrants | Grenada | 0.2 /100 | #257 | Tragic 36.3% |
| Americans | 0.2 /100 | #258 | Tragic 36.4% |
| Immigrants | El Salvador | 0.2 /100 | #259 | Tragic 36.4% |