Yugoslavian vs Salvadoran Births to Unmarried Women
COMPARE
Yugoslavian
Salvadoran
Births to Unmarried Women
Births to Unmarried Women Comparison
Yugoslavians
Salvadorans
30.8%
BIRTHS TO UNMARRIED WOMEN
75.1/ 100
METRIC RATING
154th/ 347
METRIC RANK
36.0%
BIRTHS TO UNMARRIED WOMEN
0.3/ 100
METRIC RATING
252nd/ 347
METRIC RANK
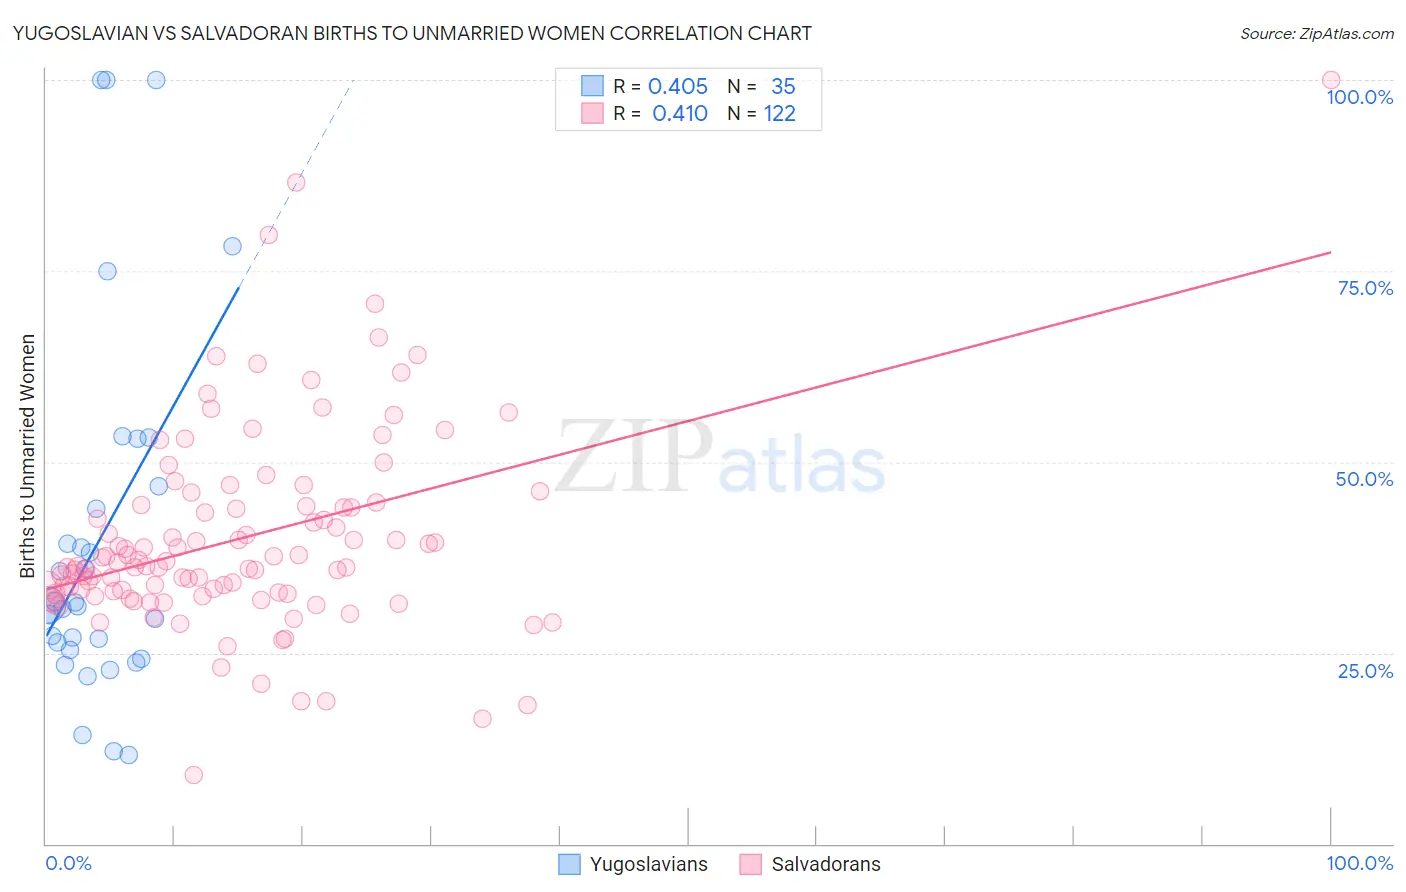
Yugoslavian vs Salvadoran Births to Unmarried Women Correlation Chart
The statistical analysis conducted on geographies consisting of 270,567,772 people shows a moderate positive correlation between the proportion of Yugoslavians and percentage of births to unmarried women in the United States with a correlation coefficient (R) of 0.405 and weighted average of 30.8%. Similarly, the statistical analysis conducted on geographies consisting of 377,312,875 people shows a moderate positive correlation between the proportion of Salvadorans and percentage of births to unmarried women in the United States with a correlation coefficient (R) of 0.410 and weighted average of 36.0%, a difference of 16.7%.
Births to Unmarried Women Correlation Summary
| Measurement | Yugoslavian | Salvadoran |
| Minimum | 11.7% | 9.0% |
| Maximum | 100.0% | 100.0% |
| Range | 88.3% | 91.0% |
| Mean | 39.8% | 40.0% |
| Median | 31.3% | 36.3% |
| Interquartile 25% (IQ1) | 25.4% | 32.7% |
| Interquartile 75% (IQ3) | 46.8% | 44.2% |
| Interquartile Range (IQR) | 21.4% | 11.5% |
| Standard Deviation (Sample) | 23.8% | 13.3% |
| Standard Deviation (Population) | 23.5% | 13.2% |
Similar Demographics by Births to Unmarried Women
Demographics Similar to Yugoslavians by Births to Unmarried Women
In terms of births to unmarried women, the demographic groups most similar to Yugoslavians are British (30.8%, a difference of 0.12%), Polish (30.8%, a difference of 0.14%), Immigrants from Bangladesh (30.9%, a difference of 0.15%), Carpatho Rusyn (30.9%, a difference of 0.20%), and Italian (30.8%, a difference of 0.25%).
| Demographics | Rating | Rank | Births to Unmarried Women |
| Immigrants | Oceania | 81.2 /100 | #147 | Excellent 30.6% |
| Chileans | 79.1 /100 | #148 | Good 30.7% |
| Serbians | 78.8 /100 | #149 | Good 30.7% |
| Somalis | 77.8 /100 | #150 | Good 30.7% |
| Italians | 77.0 /100 | #151 | Good 30.8% |
| Poles | 76.2 /100 | #152 | Good 30.8% |
| British | 76.0 /100 | #153 | Good 30.8% |
| Yugoslavians | 75.1 /100 | #154 | Good 30.8% |
| Immigrants | Bangladesh | 73.9 /100 | #155 | Good 30.9% |
| Carpatho Rusyns | 73.5 /100 | #156 | Good 30.9% |
| Immigrants | Eastern Africa | 72.1 /100 | #157 | Good 31.0% |
| Austrians | 69.9 /100 | #158 | Good 31.0% |
| Immigrants | England | 69.4 /100 | #159 | Good 31.1% |
| Immigrants | Western Europe | 69.3 /100 | #160 | Good 31.1% |
| Immigrants | Southern Europe | 68.7 /100 | #161 | Good 31.1% |
Demographics Similar to Salvadorans by Births to Unmarried Women
In terms of births to unmarried women, the demographic groups most similar to Salvadorans are Immigrants from Western Africa (36.0%, a difference of 0.12%), Immigrants from Portugal (36.2%, a difference of 0.46%), Potawatomi (36.2%, a difference of 0.68%), Mexican American Indian (35.7%, a difference of 0.69%), and Chickasaw (36.3%, a difference of 0.82%).
| Demographics | Rating | Rank | Births to Unmarried Women |
| Shoshone | 0.8 /100 | #245 | Tragic 35.3% |
| Nigerians | 0.7 /100 | #246 | Tragic 35.3% |
| Immigrants | Nigeria | 0.7 /100 | #247 | Tragic 35.4% |
| Immigrants | Nonimmigrants | 0.6 /100 | #248 | Tragic 35.5% |
| Bermudans | 0.6 /100 | #249 | Tragic 35.5% |
| Mexican American Indians | 0.4 /100 | #250 | Tragic 35.7% |
| Immigrants | Western Africa | 0.3 /100 | #251 | Tragic 36.0% |
| Salvadorans | 0.3 /100 | #252 | Tragic 36.0% |
| Immigrants | Portugal | 0.2 /100 | #253 | Tragic 36.2% |
| Potawatomi | 0.2 /100 | #254 | Tragic 36.2% |
| Chickasaw | 0.2 /100 | #255 | Tragic 36.3% |
| Immigrants | Trinidad and Tobago | 0.2 /100 | #256 | Tragic 36.3% |
| Immigrants | Grenada | 0.2 /100 | #257 | Tragic 36.3% |
| Americans | 0.2 /100 | #258 | Tragic 36.4% |
| Immigrants | El Salvador | 0.2 /100 | #259 | Tragic 36.4% |