Immigrants from Lebanon vs Salvadoran Births to Unmarried Women
COMPARE
Immigrants from Lebanon
Salvadoran
Births to Unmarried Women
Births to Unmarried Women Comparison
Immigrants from Lebanon
Salvadorans
25.3%
BIRTHS TO UNMARRIED WOMEN
100.0/ 100
METRIC RATING
14th/ 347
METRIC RANK
36.0%
BIRTHS TO UNMARRIED WOMEN
0.3/ 100
METRIC RATING
252nd/ 347
METRIC RANK
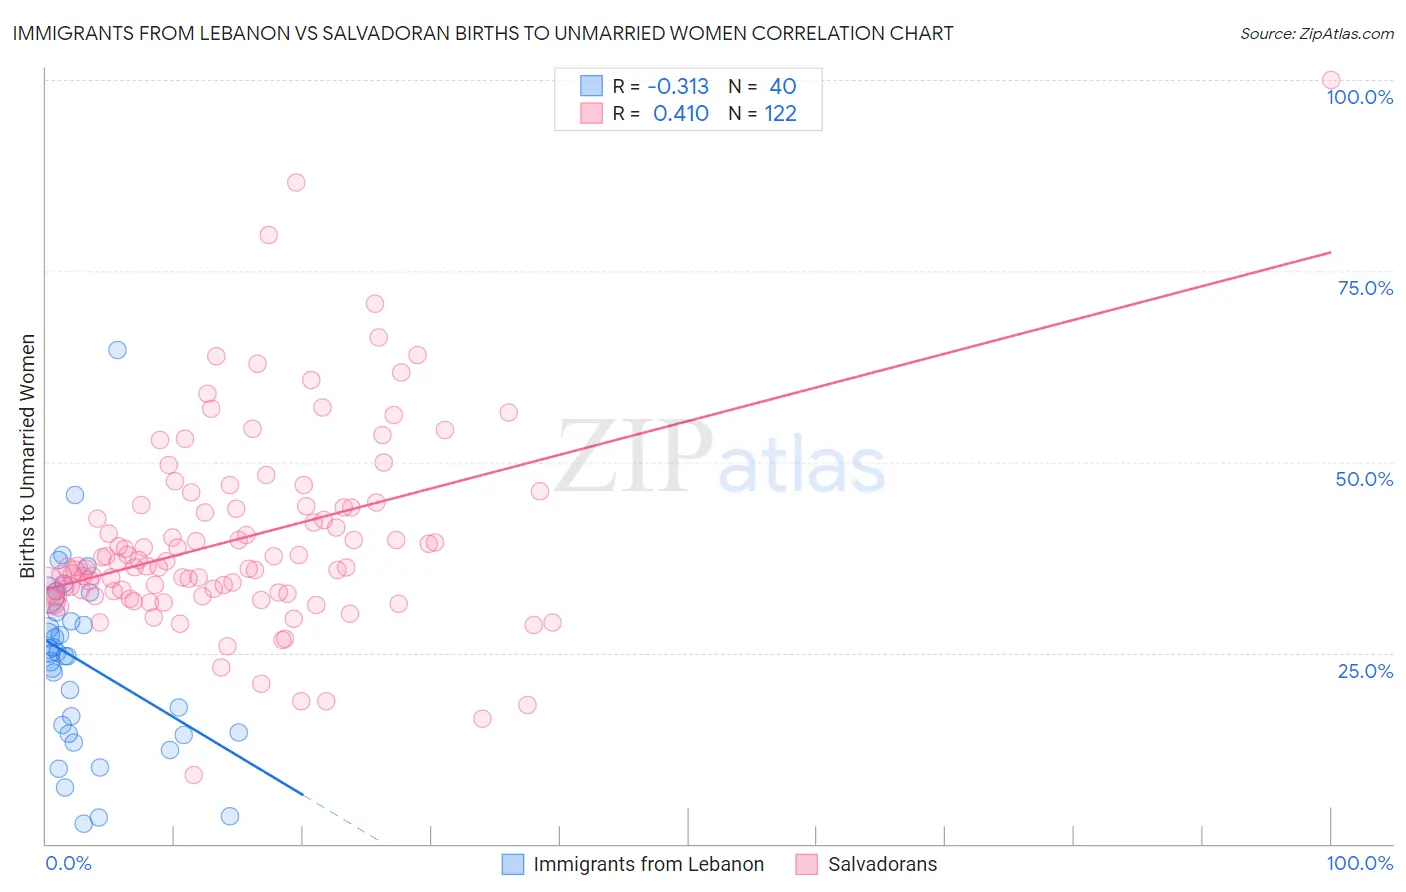
Immigrants from Lebanon vs Salvadoran Births to Unmarried Women Correlation Chart
The statistical analysis conducted on geographies consisting of 205,801,524 people shows a mild negative correlation between the proportion of Immigrants from Lebanon and percentage of births to unmarried women in the United States with a correlation coefficient (R) of -0.313 and weighted average of 25.3%. Similarly, the statistical analysis conducted on geographies consisting of 377,312,875 people shows a moderate positive correlation between the proportion of Salvadorans and percentage of births to unmarried women in the United States with a correlation coefficient (R) of 0.410 and weighted average of 36.0%, a difference of 42.1%.
Births to Unmarried Women Correlation Summary
| Measurement | Immigrants from Lebanon | Salvadoran |
| Minimum | 2.7% | 9.0% |
| Maximum | 64.7% | 100.0% |
| Range | 62.0% | 91.0% |
| Mean | 23.7% | 40.0% |
| Median | 24.8% | 36.3% |
| Interquartile 25% (IQ1) | 14.5% | 32.7% |
| Interquartile 75% (IQ3) | 29.7% | 44.2% |
| Interquartile Range (IQR) | 15.2% | 11.5% |
| Standard Deviation (Sample) | 12.2% | 13.3% |
| Standard Deviation (Population) | 12.0% | 13.2% |
Similar Demographics by Births to Unmarried Women
Demographics Similar to Immigrants from Lebanon by Births to Unmarried Women
In terms of births to unmarried women, the demographic groups most similar to Immigrants from Lebanon are Iranian (25.3%, a difference of 0.12%), Indian (Asian) (25.3%, a difference of 0.26%), Immigrants from Israel (25.1%, a difference of 0.73%), Immigrants from Eastern Asia (25.0%, a difference of 1.2%), and Immigrants from Singapore (25.6%, a difference of 1.2%).
| Demographics | Rating | Rank | Births to Unmarried Women |
| Thais | 100.0 /100 | #7 | Exceptional 24.0% |
| Immigrants | China | 100.0 /100 | #8 | Exceptional 24.7% |
| Immigrants | South Central Asia | 100.0 /100 | #9 | Exceptional 24.7% |
| Immigrants | Eastern Asia | 100.0 /100 | #10 | Exceptional 25.0% |
| Immigrants | Israel | 100.0 /100 | #11 | Exceptional 25.1% |
| Indians (Asian) | 100.0 /100 | #12 | Exceptional 25.3% |
| Iranians | 100.0 /100 | #13 | Exceptional 25.3% |
| Immigrants | Lebanon | 100.0 /100 | #14 | Exceptional 25.3% |
| Immigrants | Singapore | 100.0 /100 | #15 | Exceptional 25.6% |
| Immigrants | Belarus | 100.0 /100 | #16 | Exceptional 25.6% |
| Immigrants | Uzbekistan | 100.0 /100 | #17 | Exceptional 25.8% |
| Immigrants | Armenia | 99.9 /100 | #18 | Exceptional 26.1% |
| Armenians | 99.9 /100 | #19 | Exceptional 26.2% |
| Immigrants | Korea | 99.9 /100 | #20 | Exceptional 26.3% |
| Soviet Union | 99.9 /100 | #21 | Exceptional 26.3% |
Demographics Similar to Salvadorans by Births to Unmarried Women
In terms of births to unmarried women, the demographic groups most similar to Salvadorans are Immigrants from Western Africa (36.0%, a difference of 0.12%), Immigrants from Portugal (36.2%, a difference of 0.46%), Potawatomi (36.2%, a difference of 0.68%), Mexican American Indian (35.7%, a difference of 0.69%), and Chickasaw (36.3%, a difference of 0.82%).
| Demographics | Rating | Rank | Births to Unmarried Women |
| Shoshone | 0.8 /100 | #245 | Tragic 35.3% |
| Nigerians | 0.7 /100 | #246 | Tragic 35.3% |
| Immigrants | Nigeria | 0.7 /100 | #247 | Tragic 35.4% |
| Immigrants | Nonimmigrants | 0.6 /100 | #248 | Tragic 35.5% |
| Bermudans | 0.6 /100 | #249 | Tragic 35.5% |
| Mexican American Indians | 0.4 /100 | #250 | Tragic 35.7% |
| Immigrants | Western Africa | 0.3 /100 | #251 | Tragic 36.0% |
| Salvadorans | 0.3 /100 | #252 | Tragic 36.0% |
| Immigrants | Portugal | 0.2 /100 | #253 | Tragic 36.2% |
| Potawatomi | 0.2 /100 | #254 | Tragic 36.2% |
| Chickasaw | 0.2 /100 | #255 | Tragic 36.3% |
| Immigrants | Trinidad and Tobago | 0.2 /100 | #256 | Tragic 36.3% |
| Immigrants | Grenada | 0.2 /100 | #257 | Tragic 36.3% |
| Americans | 0.2 /100 | #258 | Tragic 36.4% |
| Immigrants | El Salvador | 0.2 /100 | #259 | Tragic 36.4% |