Paiute vs Immigrants from Belgium Births to Unmarried Women
COMPARE
Paiute
Immigrants from Belgium
Births to Unmarried Women
Births to Unmarried Women Comparison
Paiute
Immigrants from Belgium
42.5%
BIRTHS TO UNMARRIED WOMEN
0.0/ 100
METRIC RATING
329th/ 347
METRIC RANK
28.0%
BIRTHS TO UNMARRIED WOMEN
99.3/ 100
METRIC RATING
56th/ 347
METRIC RANK
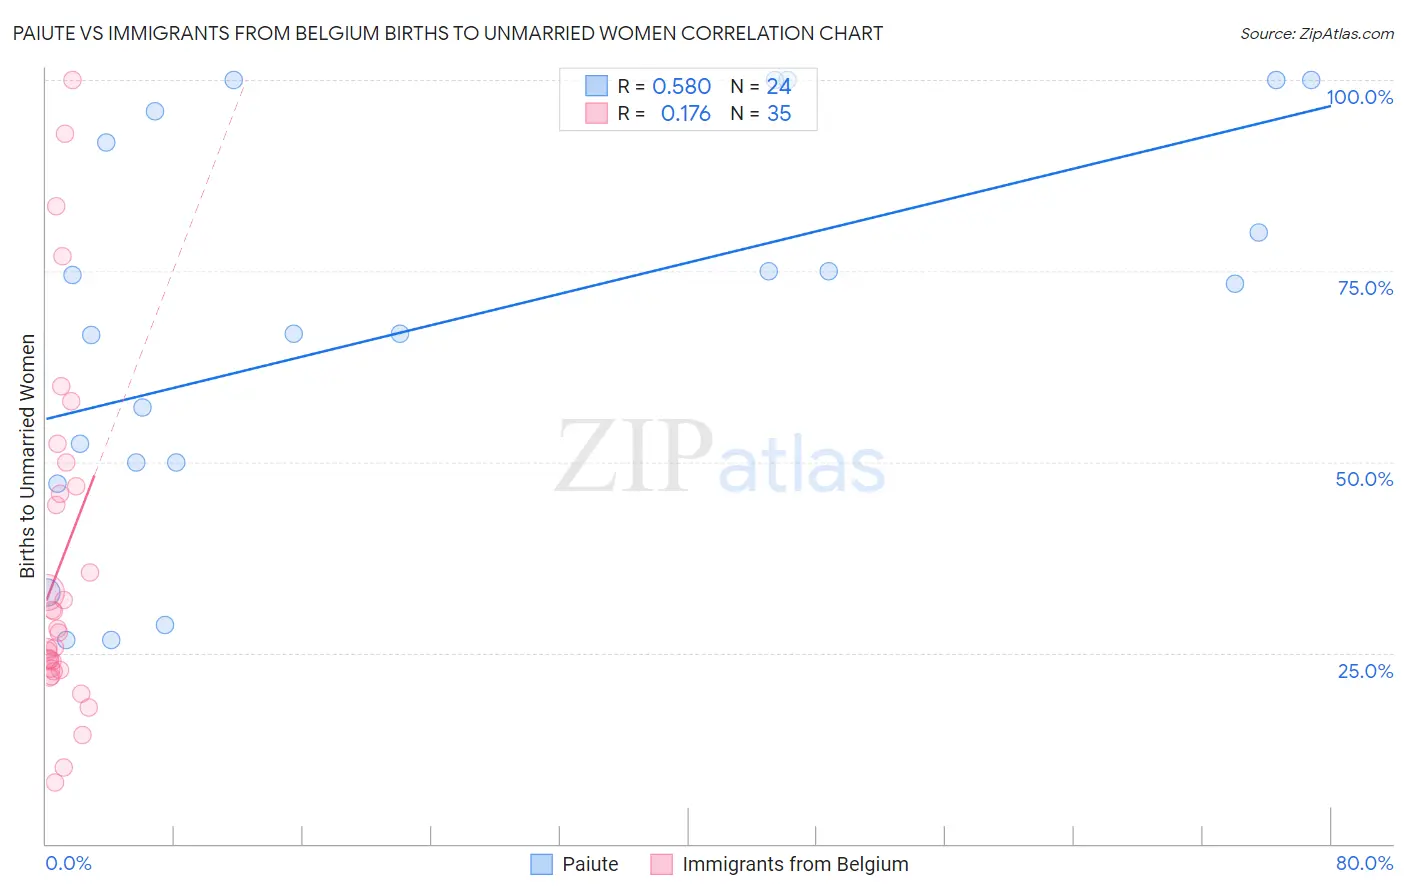
Paiute vs Immigrants from Belgium Births to Unmarried Women Correlation Chart
The statistical analysis conducted on geographies consisting of 57,331,640 people shows a substantial positive correlation between the proportion of Paiute and percentage of births to unmarried women in the United States with a correlation coefficient (R) of 0.580 and weighted average of 42.5%. Similarly, the statistical analysis conducted on geographies consisting of 139,482,659 people shows a poor positive correlation between the proportion of Immigrants from Belgium and percentage of births to unmarried women in the United States with a correlation coefficient (R) of 0.176 and weighted average of 28.0%, a difference of 51.7%.
Births to Unmarried Women Correlation Summary
| Measurement | Paiute | Immigrants from Belgium |
| Minimum | 26.6% | 8.0% |
| Maximum | 100.0% | 100.0% |
| Range | 73.4% | 92.0% |
| Mean | 68.2% | 36.6% |
| Median | 70.0% | 27.6% |
| Interquartile 25% (IQ1) | 50.0% | 22.8% |
| Interquartile 75% (IQ3) | 93.9% | 46.8% |
| Interquartile Range (IQR) | 43.9% | 24.0% |
| Standard Deviation (Sample) | 25.1% | 22.8% |
| Standard Deviation (Population) | 24.5% | 22.4% |
Similar Demographics by Births to Unmarried Women
Demographics Similar to Paiute by Births to Unmarried Women
In terms of births to unmarried women, the demographic groups most similar to Paiute are Chippewa (42.6%, a difference of 0.40%), Immigrants from Cabo Verde (42.2%, a difference of 0.60%), Tsimshian (42.2%, a difference of 0.74%), Native/Alaskan (43.0%, a difference of 1.2%), and Kiowa (43.1%, a difference of 1.6%).
| Demographics | Rating | Rank | Births to Unmarried Women |
| Cajuns | 0.0 /100 | #322 | Tragic 41.0% |
| Sioux | 0.0 /100 | #323 | Tragic 41.0% |
| Cape Verdeans | 0.0 /100 | #324 | Tragic 41.3% |
| Cheyenne | 0.0 /100 | #325 | Tragic 41.3% |
| Immigrants | Cuba | 0.0 /100 | #326 | Tragic 41.5% |
| Tsimshian | 0.0 /100 | #327 | Tragic 42.2% |
| Immigrants | Cabo Verde | 0.0 /100 | #328 | Tragic 42.2% |
| Paiute | 0.0 /100 | #329 | Tragic 42.5% |
| Chippewa | 0.0 /100 | #330 | Tragic 42.6% |
| Natives/Alaskans | 0.0 /100 | #331 | Tragic 43.0% |
| Kiowa | 0.0 /100 | #332 | Tragic 43.1% |
| Blacks/African Americans | 0.0 /100 | #333 | Tragic 44.3% |
| Yuman | 0.0 /100 | #334 | Tragic 44.4% |
| Colville | 0.0 /100 | #335 | Tragic 45.3% |
| Puerto Ricans | 0.0 /100 | #336 | Tragic 45.7% |
Demographics Similar to Immigrants from Belgium by Births to Unmarried Women
In terms of births to unmarried women, the demographic groups most similar to Immigrants from Belgium are Russian (28.0%, a difference of 0.13%), Immigrants from Albania (28.0%, a difference of 0.24%), Mongolian (27.9%, a difference of 0.26%), Afghan (27.9%, a difference of 0.30%), and Immigrants from Romania (27.9%, a difference of 0.37%).
| Demographics | Rating | Rank | Births to Unmarried Women |
| Immigrants | Greece | 99.4 /100 | #49 | Exceptional 27.8% |
| Maltese | 99.4 /100 | #50 | Exceptional 27.8% |
| Macedonians | 99.4 /100 | #51 | Exceptional 27.9% |
| Bhutanese | 99.4 /100 | #52 | Exceptional 27.9% |
| Immigrants | Romania | 99.4 /100 | #53 | Exceptional 27.9% |
| Afghans | 99.4 /100 | #54 | Exceptional 27.9% |
| Mongolians | 99.3 /100 | #55 | Exceptional 27.9% |
| Immigrants | Belgium | 99.3 /100 | #56 | Exceptional 28.0% |
| Russians | 99.2 /100 | #57 | Exceptional 28.0% |
| Immigrants | Albania | 99.2 /100 | #58 | Exceptional 28.0% |
| Immigrants | Kazakhstan | 99.1 /100 | #59 | Exceptional 28.1% |
| Immigrants | Turkey | 99.1 /100 | #60 | Exceptional 28.1% |
| Immigrants | North Macedonia | 99.1 /100 | #61 | Exceptional 28.1% |
| Egyptians | 99.0 /100 | #62 | Exceptional 28.2% |
| Immigrants | Serbia | 98.9 /100 | #63 | Exceptional 28.3% |