Immigrants from Congo vs Salvadoran Births to Unmarried Women
COMPARE
Immigrants from Congo
Salvadoran
Births to Unmarried Women
Births to Unmarried Women Comparison
Immigrants from Congo
Salvadorans
36.8%
BIRTHS TO UNMARRIED WOMEN
0.1/ 100
METRIC RATING
270th/ 347
METRIC RANK
36.0%
BIRTHS TO UNMARRIED WOMEN
0.3/ 100
METRIC RATING
252nd/ 347
METRIC RANK
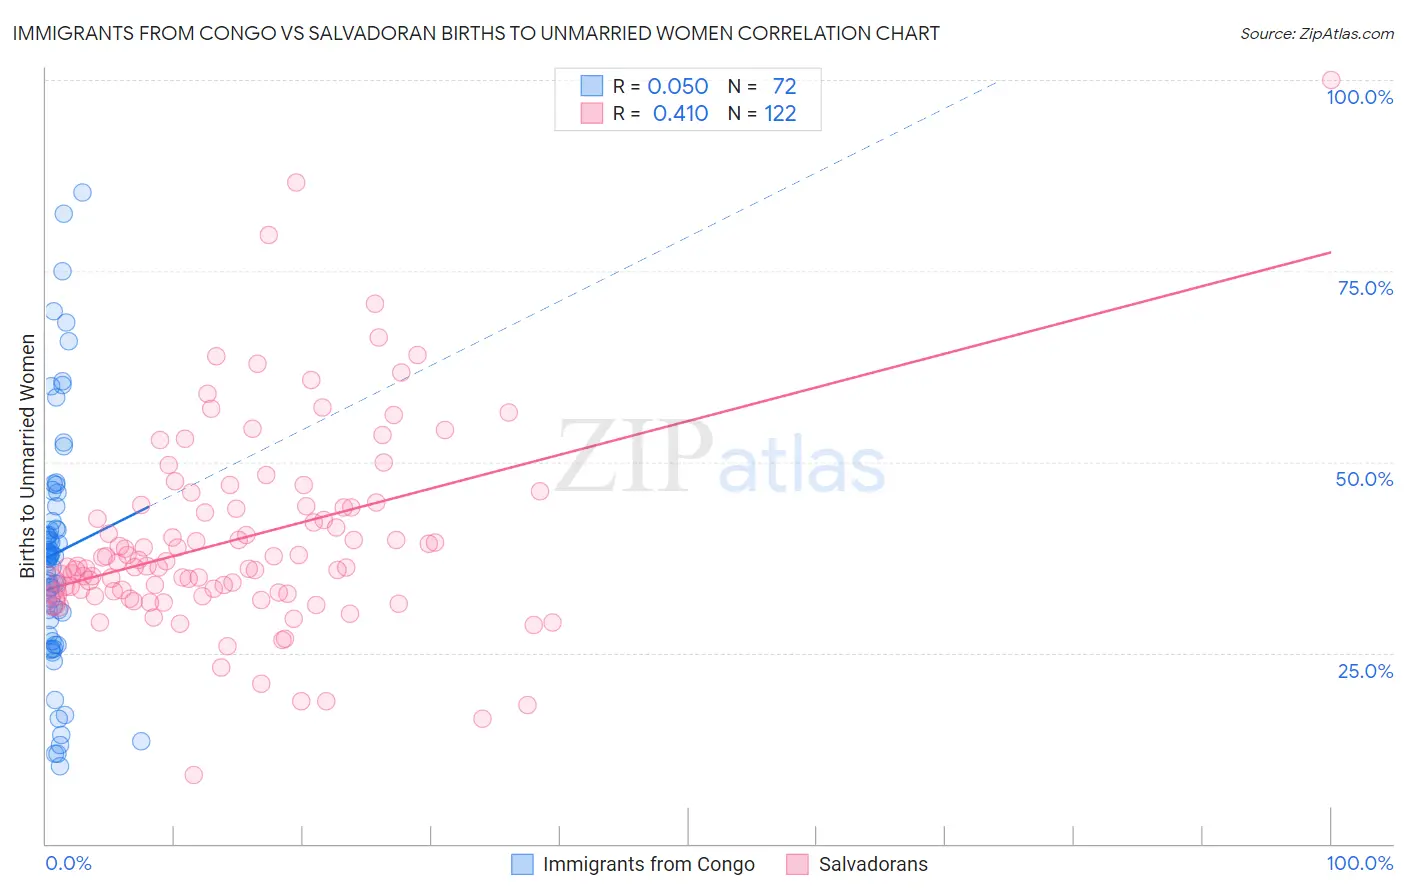
Immigrants from Congo vs Salvadoran Births to Unmarried Women Correlation Chart
The statistical analysis conducted on geographies consisting of 91,138,649 people shows no correlation between the proportion of Immigrants from Congo and percentage of births to unmarried women in the United States with a correlation coefficient (R) of 0.050 and weighted average of 36.8%. Similarly, the statistical analysis conducted on geographies consisting of 377,312,875 people shows a moderate positive correlation between the proportion of Salvadorans and percentage of births to unmarried women in the United States with a correlation coefficient (R) of 0.410 and weighted average of 36.0%, a difference of 2.2%.
Births to Unmarried Women Correlation Summary
| Measurement | Immigrants from Congo | Salvadoran |
| Minimum | 10.2% | 9.0% |
| Maximum | 85.3% | 100.0% |
| Range | 75.1% | 91.0% |
| Mean | 38.0% | 40.0% |
| Median | 37.5% | 36.3% |
| Interquartile 25% (IQ1) | 28.3% | 32.7% |
| Interquartile 75% (IQ3) | 43.2% | 44.2% |
| Interquartile Range (IQR) | 14.9% | 11.5% |
| Standard Deviation (Sample) | 16.0% | 13.3% |
| Standard Deviation (Population) | 15.9% | 13.2% |
Demographics Similar to Immigrants from Congo and Salvadorans by Births to Unmarried Women
In terms of births to unmarried women, the demographic groups most similar to Immigrants from Congo are Immigrants from Barbados (36.8%, a difference of 0.030%), Senegalese (36.8%, a difference of 0.080%), Comanche (36.7%, a difference of 0.20%), Central American (36.7%, a difference of 0.21%), and Immigrants from Senegal (36.7%, a difference of 0.28%). Similarly, the demographic groups most similar to Salvadorans are Immigrants from Western Africa (36.0%, a difference of 0.12%), Immigrants from Portugal (36.2%, a difference of 0.46%), Potawatomi (36.2%, a difference of 0.68%), Chickasaw (36.3%, a difference of 0.82%), and Immigrants from Trinidad and Tobago (36.3%, a difference of 0.82%).
| Demographics | Rating | Rank | Births to Unmarried Women |
| Immigrants | Western Africa | 0.3 /100 | #251 | Tragic 36.0% |
| Salvadorans | 0.3 /100 | #252 | Tragic 36.0% |
| Immigrants | Portugal | 0.2 /100 | #253 | Tragic 36.2% |
| Potawatomi | 0.2 /100 | #254 | Tragic 36.2% |
| Chickasaw | 0.2 /100 | #255 | Tragic 36.3% |
| Immigrants | Trinidad and Tobago | 0.2 /100 | #256 | Tragic 36.3% |
| Immigrants | Grenada | 0.2 /100 | #257 | Tragic 36.3% |
| Americans | 0.2 /100 | #258 | Tragic 36.4% |
| Immigrants | El Salvador | 0.2 /100 | #259 | Tragic 36.4% |
| Ottawa | 0.2 /100 | #260 | Tragic 36.5% |
| Trinidadians and Tobagonians | 0.2 /100 | #261 | Tragic 36.5% |
| French American Indians | 0.1 /100 | #262 | Tragic 36.6% |
| Nicaraguans | 0.1 /100 | #263 | Tragic 36.6% |
| Sub-Saharan Africans | 0.1 /100 | #264 | Tragic 36.7% |
| Cherokee | 0.1 /100 | #265 | Tragic 36.7% |
| Immigrants | Senegal | 0.1 /100 | #266 | Tragic 36.7% |
| Central Americans | 0.1 /100 | #267 | Tragic 36.7% |
| Comanche | 0.1 /100 | #268 | Tragic 36.7% |
| Senegalese | 0.1 /100 | #269 | Tragic 36.8% |
| Immigrants | Congo | 0.1 /100 | #270 | Tragic 36.8% |
| Immigrants | Barbados | 0.1 /100 | #271 | Tragic 36.8% |