Nepalese vs Salvadoran Births to Unmarried Women
COMPARE
Nepalese
Salvadoran
Births to Unmarried Women
Births to Unmarried Women Comparison
Nepalese
Salvadorans
33.5%
BIRTHS TO UNMARRIED WOMEN
7.8/ 100
METRIC RATING
216th/ 347
METRIC RANK
36.0%
BIRTHS TO UNMARRIED WOMEN
0.3/ 100
METRIC RATING
252nd/ 347
METRIC RANK
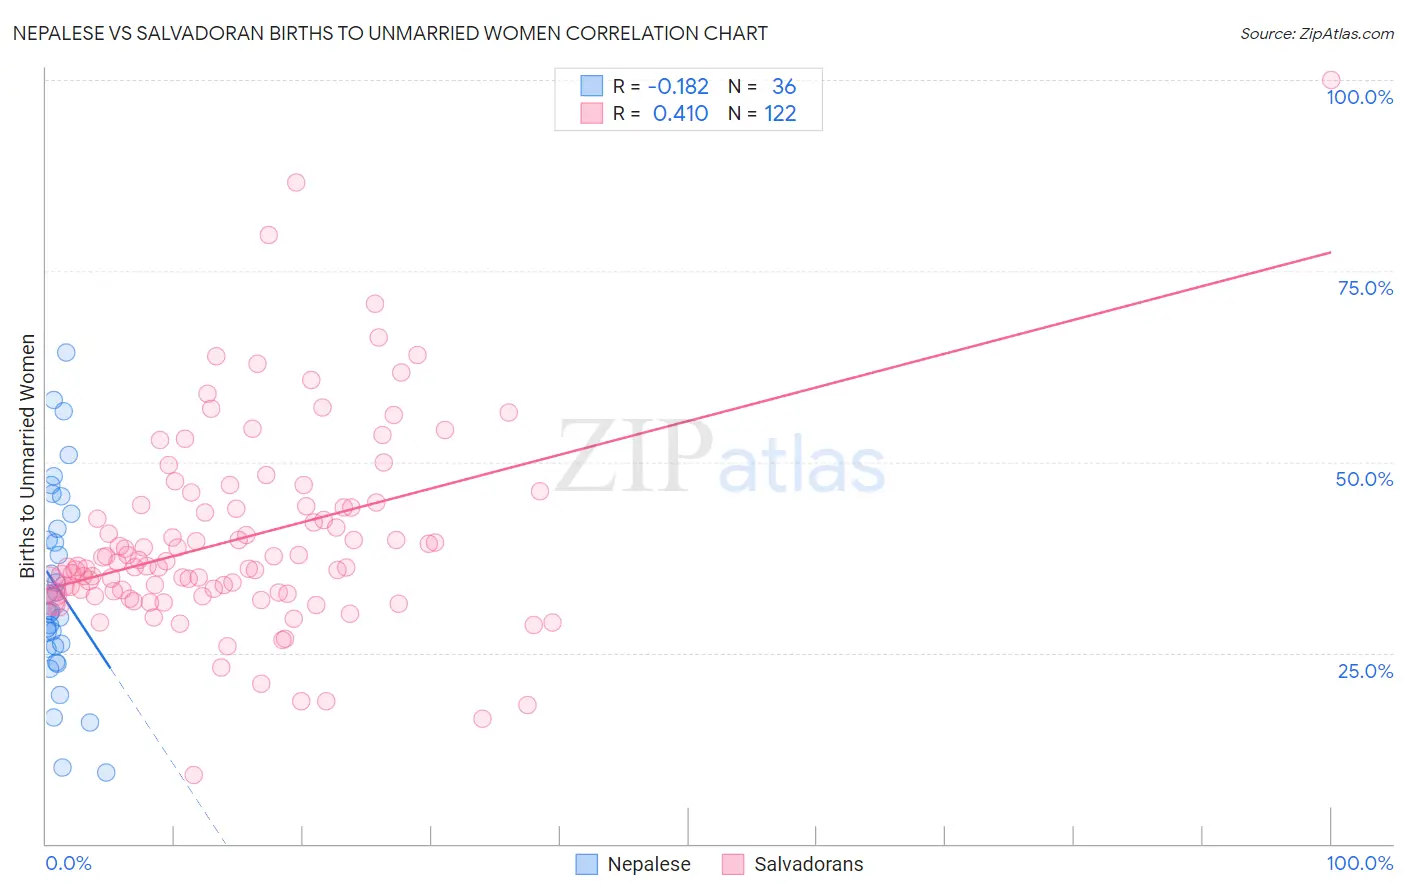
Nepalese vs Salvadoran Births to Unmarried Women Correlation Chart
The statistical analysis conducted on geographies consisting of 24,298,427 people shows a poor negative correlation between the proportion of Nepalese and percentage of births to unmarried women in the United States with a correlation coefficient (R) of -0.182 and weighted average of 33.5%. Similarly, the statistical analysis conducted on geographies consisting of 377,312,875 people shows a moderate positive correlation between the proportion of Salvadorans and percentage of births to unmarried women in the United States with a correlation coefficient (R) of 0.410 and weighted average of 36.0%, a difference of 7.4%.
Births to Unmarried Women Correlation Summary
| Measurement | Nepalese | Salvadoran |
| Minimum | 9.3% | 9.0% |
| Maximum | 64.3% | 100.0% |
| Range | 55.0% | 91.0% |
| Mean | 33.5% | 40.0% |
| Median | 30.4% | 36.3% |
| Interquartile 25% (IQ1) | 25.7% | 32.7% |
| Interquartile 75% (IQ3) | 42.2% | 44.2% |
| Interquartile Range (IQR) | 16.5% | 11.5% |
| Standard Deviation (Sample) | 13.0% | 13.3% |
| Standard Deviation (Population) | 12.8% | 13.2% |
Similar Demographics by Births to Unmarried Women
Demographics Similar to Nepalese by Births to Unmarried Women
In terms of births to unmarried women, the demographic groups most similar to Nepalese are Spaniard (33.6%, a difference of 0.24%), French (33.4%, a difference of 0.27%), Slovak (33.4%, a difference of 0.45%), Immigrants from Costa Rica (33.4%, a difference of 0.49%), and Immigrants from Ecuador (33.7%, a difference of 0.64%).
| Demographics | Rating | Rank | Births to Unmarried Women |
| Whites/Caucasians | 10.7 /100 | #209 | Poor 33.3% |
| Scotch-Irish | 10.7 /100 | #210 | Poor 33.3% |
| Ecuadorians | 10.5 /100 | #211 | Poor 33.3% |
| Celtics | 10.2 /100 | #212 | Poor 33.3% |
| Immigrants | Costa Rica | 9.5 /100 | #213 | Tragic 33.4% |
| Slovaks | 9.3 /100 | #214 | Tragic 33.4% |
| French | 8.7 /100 | #215 | Tragic 33.4% |
| Nepalese | 7.8 /100 | #216 | Tragic 33.5% |
| Spaniards | 7.0 /100 | #217 | Tragic 33.6% |
| Immigrants | Ecuador | 5.9 /100 | #218 | Tragic 33.7% |
| Alsatians | 5.4 /100 | #219 | Tragic 33.8% |
| Portuguese | 5.4 /100 | #220 | Tragic 33.8% |
| Malaysians | 5.0 /100 | #221 | Tragic 33.9% |
| Immigrants | Uruguay | 4.8 /100 | #222 | Tragic 33.9% |
| Pennsylvania Germans | 4.3 /100 | #223 | Tragic 34.0% |
Demographics Similar to Salvadorans by Births to Unmarried Women
In terms of births to unmarried women, the demographic groups most similar to Salvadorans are Immigrants from Western Africa (36.0%, a difference of 0.12%), Immigrants from Portugal (36.2%, a difference of 0.46%), Potawatomi (36.2%, a difference of 0.68%), Mexican American Indian (35.7%, a difference of 0.69%), and Chickasaw (36.3%, a difference of 0.82%).
| Demographics | Rating | Rank | Births to Unmarried Women |
| Shoshone | 0.8 /100 | #245 | Tragic 35.3% |
| Nigerians | 0.7 /100 | #246 | Tragic 35.3% |
| Immigrants | Nigeria | 0.7 /100 | #247 | Tragic 35.4% |
| Immigrants | Nonimmigrants | 0.6 /100 | #248 | Tragic 35.5% |
| Bermudans | 0.6 /100 | #249 | Tragic 35.5% |
| Mexican American Indians | 0.4 /100 | #250 | Tragic 35.7% |
| Immigrants | Western Africa | 0.3 /100 | #251 | Tragic 36.0% |
| Salvadorans | 0.3 /100 | #252 | Tragic 36.0% |
| Immigrants | Portugal | 0.2 /100 | #253 | Tragic 36.2% |
| Potawatomi | 0.2 /100 | #254 | Tragic 36.2% |
| Chickasaw | 0.2 /100 | #255 | Tragic 36.3% |
| Immigrants | Trinidad and Tobago | 0.2 /100 | #256 | Tragic 36.3% |
| Immigrants | Grenada | 0.2 /100 | #257 | Tragic 36.3% |
| Americans | 0.2 /100 | #258 | Tragic 36.4% |
| Immigrants | El Salvador | 0.2 /100 | #259 | Tragic 36.4% |