Paiute vs Central American Indian Births to Unmarried Women
COMPARE
Paiute
Central American Indian
Births to Unmarried Women
Births to Unmarried Women Comparison
Paiute
Central American Indians
42.5%
BIRTHS TO UNMARRIED WOMEN
0.0/ 100
METRIC RATING
329th/ 347
METRIC RANK
39.0%
BIRTHS TO UNMARRIED WOMEN
0.0/ 100
METRIC RATING
306th/ 347
METRIC RANK
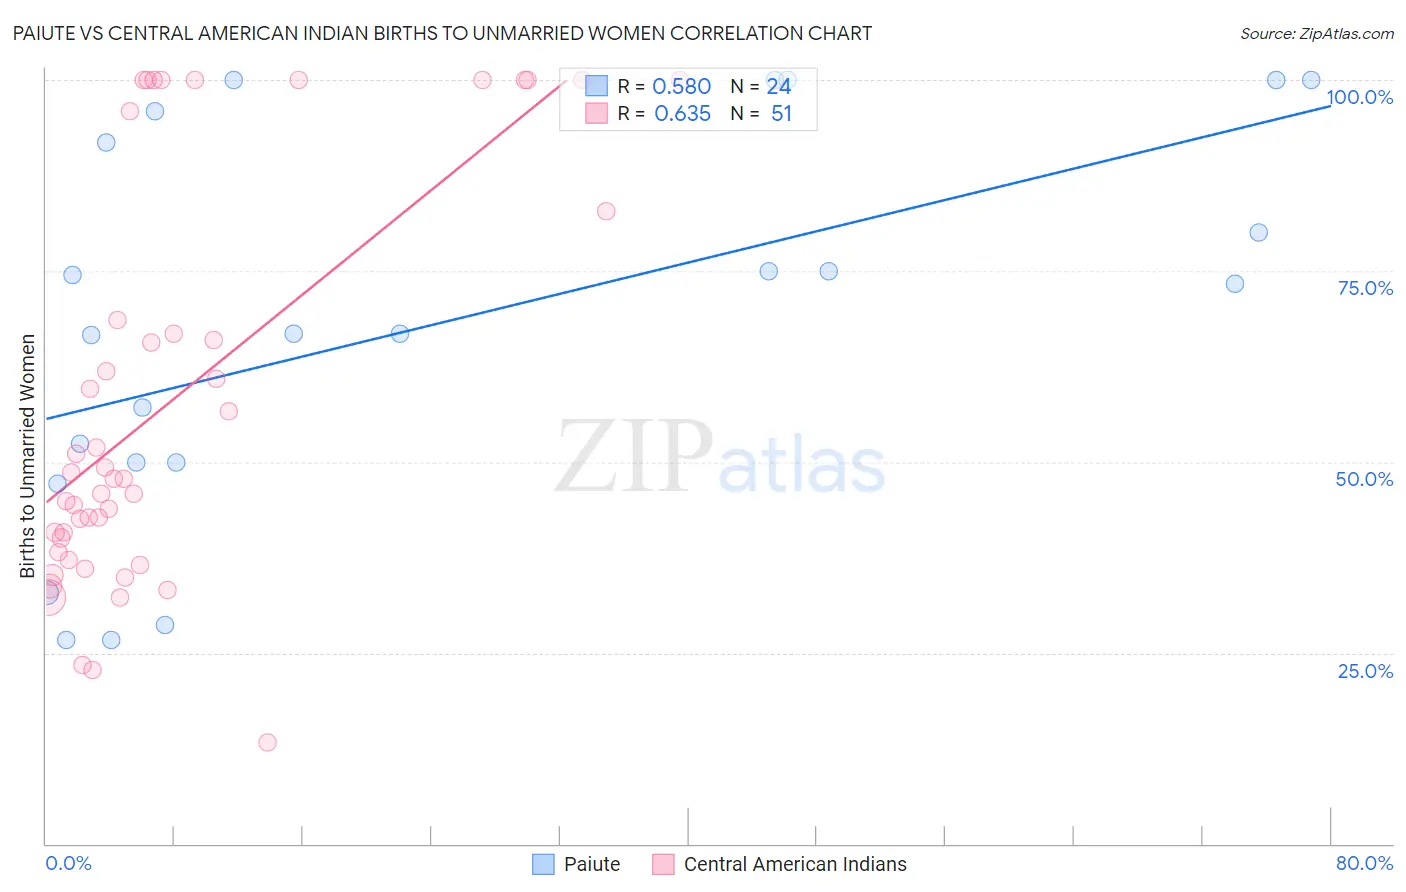
Paiute vs Central American Indian Births to Unmarried Women Correlation Chart
The statistical analysis conducted on geographies consisting of 57,331,640 people shows a substantial positive correlation between the proportion of Paiute and percentage of births to unmarried women in the United States with a correlation coefficient (R) of 0.580 and weighted average of 42.5%. Similarly, the statistical analysis conducted on geographies consisting of 312,295,500 people shows a significant positive correlation between the proportion of Central American Indians and percentage of births to unmarried women in the United States with a correlation coefficient (R) of 0.635 and weighted average of 39.0%, a difference of 9.0%.
Births to Unmarried Women Correlation Summary
| Measurement | Paiute | Central American Indian |
| Minimum | 26.6% | 13.2% |
| Maximum | 100.0% | 100.0% |
| Range | 73.4% | 86.8% |
| Mean | 68.2% | 58.1% |
| Median | 70.0% | 47.9% |
| Interquartile 25% (IQ1) | 50.0% | 38.2% |
| Interquartile 75% (IQ3) | 93.9% | 82.8% |
| Interquartile Range (IQR) | 43.9% | 44.6% |
| Standard Deviation (Sample) | 25.1% | 26.3% |
| Standard Deviation (Population) | 24.5% | 26.0% |
Similar Demographics by Births to Unmarried Women
Demographics Similar to Paiute by Births to Unmarried Women
In terms of births to unmarried women, the demographic groups most similar to Paiute are Chippewa (42.6%, a difference of 0.40%), Immigrants from Cabo Verde (42.2%, a difference of 0.60%), Tsimshian (42.2%, a difference of 0.74%), Native/Alaskan (43.0%, a difference of 1.2%), and Kiowa (43.1%, a difference of 1.6%).
| Demographics | Rating | Rank | Births to Unmarried Women |
| Cajuns | 0.0 /100 | #322 | Tragic 41.0% |
| Sioux | 0.0 /100 | #323 | Tragic 41.0% |
| Cape Verdeans | 0.0 /100 | #324 | Tragic 41.3% |
| Cheyenne | 0.0 /100 | #325 | Tragic 41.3% |
| Immigrants | Cuba | 0.0 /100 | #326 | Tragic 41.5% |
| Tsimshian | 0.0 /100 | #327 | Tragic 42.2% |
| Immigrants | Cabo Verde | 0.0 /100 | #328 | Tragic 42.2% |
| Paiute | 0.0 /100 | #329 | Tragic 42.5% |
| Chippewa | 0.0 /100 | #330 | Tragic 42.6% |
| Natives/Alaskans | 0.0 /100 | #331 | Tragic 43.0% |
| Kiowa | 0.0 /100 | #332 | Tragic 43.1% |
| Blacks/African Americans | 0.0 /100 | #333 | Tragic 44.3% |
| Yuman | 0.0 /100 | #334 | Tragic 44.4% |
| Colville | 0.0 /100 | #335 | Tragic 45.3% |
| Puerto Ricans | 0.0 /100 | #336 | Tragic 45.7% |
Demographics Similar to Central American Indians by Births to Unmarried Women
In terms of births to unmarried women, the demographic groups most similar to Central American Indians are Immigrants from Haiti (38.9%, a difference of 0.29%), Yaqui (38.8%, a difference of 0.39%), Immigrants from Jamaica (38.8%, a difference of 0.44%), Honduran (38.7%, a difference of 0.76%), and Immigrants from Honduras (39.3%, a difference of 0.86%).
| Demographics | Rating | Rank | Births to Unmarried Women |
| Spanish Americans | 0.0 /100 | #299 | Tragic 38.6% |
| Immigrants | West Indies | 0.0 /100 | #300 | Tragic 38.6% |
| Haitians | 0.0 /100 | #301 | Tragic 38.6% |
| Hondurans | 0.0 /100 | #302 | Tragic 38.7% |
| Immigrants | Jamaica | 0.0 /100 | #303 | Tragic 38.8% |
| Yaqui | 0.0 /100 | #304 | Tragic 38.8% |
| Immigrants | Haiti | 0.0 /100 | #305 | Tragic 38.9% |
| Central American Indians | 0.0 /100 | #306 | Tragic 39.0% |
| Immigrants | Honduras | 0.0 /100 | #307 | Tragic 39.3% |
| Aleuts | 0.0 /100 | #308 | Tragic 39.3% |
| Cubans | 0.0 /100 | #309 | Tragic 39.4% |
| Immigrants | Dominica | 0.0 /100 | #310 | Tragic 39.5% |
| Immigrants | Azores | 0.0 /100 | #311 | Tragic 39.6% |
| U.S. Virgin Islanders | 0.0 /100 | #312 | Tragic 39.6% |
| Africans | 0.0 /100 | #313 | Tragic 39.7% |