Paiute vs Immigrants from Nepal Births to Unmarried Women

COMPARE

Paiute
Race
Ancestry
AfghanAfricanAlaska NativeAlaskan AthabascanAlbanianAleutAlsatianAmericanApacheArabArapahoArgentineanArmenianAssyrian/Chaldean/SyriacAustralianAustrianBahamianBangladeshiBarbadianBasqueBelgianBelizeanBermudanBhutaneseBlackfeetBolivianBrazilianBritishBritish West IndianBulgarianBurmeseCajunCambodianCanadianCape VerdeanCarpatho RusynCelticCentral AmericanCentral American IndianCherokeeCheyenneChickasawChileanChineseChippewaChoctawColombianColvilleComancheCosta RicanCreeCreekCroatianCrowCubanCypriotCzechCzechoslovakianDanishDelawareDominicanDutchDutch West IndianEastern EuropeanEcuadorianEgyptianEnglishEstonianEthiopianEuropeanFijianFilipinoFinnishFrenchFrench American IndianFrench CanadianGermanGerman RussianGhanaianGreekGuamanian/ChamorroGuatemalanGuyaneseHaitianHmongHonduranHopiHoumaHungarianIcelanderIndian (Asian)IndonesianInupiatIranianIraqiIrishIroquoisIsraeliItalianJamaicanJapaneseJordanianKenyanKiowaKoreanLaotianLatvianLebaneseLiberianLithuanianLumbeeLuxembourgerMacedonianMalaysianMalteseMarshalleseMenomineeMexicanMexican American IndianMongolianMoroccanNative HawaiianNavajoNepaleseNew ZealanderNicaraguanNigerianNorthern EuropeanNorwegianOkinawanOsageOttawaPaiutePakistaniPalestinianPanamanianParaguayanPennsylvania GermanPeruvianPimaPolishPortuguesePotawatomiPuebloPuerto RicanPuget Sound SalishRomanianRussianSalvadoranSamoanScandinavianScotch-IrishScottishSeminoleSenegaleseSerbianShoshoneSierra LeoneanSiouxSlavicSlovakSloveneSomaliSouth AfricanSouth AmericanSouth American IndianSoviet UnionSpaniardSpanishSpanish AmericanSpanish American IndianSri LankanSubsaharan AfricanSudaneseSwedishSwissSyrianTaiwaneseThaiTlingit-HaidaTohono O'OdhamTonganTrinidadian and TobagonianTsimshianTurkishU.S. Virgin IslanderUgandanUkrainianUruguayanUteVenezuelanVietnameseWelshWest IndianYakamaYaquiYugoslavianYumanYup'ikZimbabwean
Immigration
NonimmigrantsImmigrantsAfghanistanAfricaAlbaniaArgentinaArmeniaAsiaAustraliaAustriaBahamasBangladeshBarbadosBelarusBelgiumBelizeBoliviaBosnia and HerzegovinaBrazilBulgariaBurma/MyanmarCabo VerdeCambodiaCameroonCanadaCaribbeanCentral AmericaChileChinaColombiaCongoCosta RicaCroatiaCubaCzechoslovakiaDenmarkDominicaDominican RepublicEastern AfricaEastern AsiaEastern EuropeEcuadorEgyptEl SalvadorEnglandEritreaEthiopiaEuropeFijiFranceGermanyGhanaGreeceGrenadaGuatemalaGuyanaHaitiHondurasHong KongHungaryIndiaIndonesiaIranIraqIrelandIsraelItalyJamaicaJapanJordanKazakhstanKenyaKoreaKuwaitLaosLatin AmericaLatviaLebanonLiberiaLithuaniaMalaysiaMexicoMicronesiaMiddle AfricaMoldovaMoroccoNetherlandsNicaraguaNigeriaNorth AmericaNorth MacedoniaNorthern AfricaNorthern EuropeNorwayOceaniaPakistanPanamaPeruPhilippinesPolandPortugalRomaniaRussiaSaudi ArabiaScotlandSenegalSerbiaSierra LeoneSingaporeSomaliaSouth AfricaSouth AmericaSouth Central AsiaSouth Eastern AsiaSouthern EuropeSpainSri LankaSt. Vincent and the GrenadinesSudanSwedenSwitzerlandSyriaTaiwanThailandTrinidad and TobagoTurkeyUgandaUkraineUruguayUzbekistanVenezuelaVietnamWest IndiesWestern AfricaWestern AsiaWestern EuropeYemenZaireZimbabweAzores
Immigrants from Nepal
Race
Ancestry
AfghanAfricanAlaska NativeAlaskan AthabascanAlbanianAleutAlsatianAmericanApacheArabArapahoArgentineanArmenianAssyrian/Chaldean/SyriacAustralianAustrianBahamianBangladeshiBarbadianBasqueBelgianBelizeanBermudanBhutaneseBlackfeetBolivianBrazilianBritishBritish West IndianBulgarianBurmeseCajunCambodianCanadianCape VerdeanCarpatho RusynCelticCentral AmericanCentral American IndianCherokeeCheyenneChickasawChileanChineseChippewaChoctawColombianColvilleComancheCosta RicanCreeCreekCroatianCrowCubanCypriotCzechCzechoslovakianDanishDelawareDominicanDutchDutch West IndianEastern EuropeanEcuadorianEgyptianEnglishEstonianEthiopianEuropeanFijianFilipinoFinnishFrenchFrench American IndianFrench CanadianGermanGerman RussianGhanaianGreekGuamanian/ChamorroGuatemalanGuyaneseHaitianHmongHonduranHopiHoumaHungarianIcelanderIndian (Asian)IndonesianInupiatIranianIraqiIrishIroquoisIsraeliItalianJamaicanJapaneseJordanianKenyanKiowaKoreanLaotianLatvianLebaneseLiberianLithuanianLumbeeLuxembourgerMacedonianMalaysianMalteseMarshalleseMenomineeMexicanMexican American IndianMongolianMoroccanNative HawaiianNavajoNepaleseNew ZealanderNicaraguanNigerianNorthern EuropeanNorwegianOkinawanOsageOttawaPakistaniPalestinianPanamanianParaguayanPennsylvania GermanPeruvianPimaPolishPortuguesePotawatomiPuebloPuerto RicanPuget Sound SalishRomanianRussianSalvadoranSamoanScandinavianScotch-IrishScottishSeminoleSenegaleseSerbianShoshoneSierra LeoneanSiouxSlavicSlovakSloveneSomaliSouth AfricanSouth AmericanSouth American IndianSoviet UnionSpaniardSpanishSpanish AmericanSpanish American IndianSri LankanSubsaharan AfricanSudaneseSwedishSwissSyrianTaiwaneseThaiTlingit-HaidaTohono O'OdhamTonganTrinidadian and TobagonianTsimshianTurkishU.S. Virgin IslanderUgandanUkrainianUruguayanUteVenezuelanVietnameseWelshWest IndianYakamaYaquiYugoslavianYumanYup'ikZimbabwean
Immigration
NonimmigrantsImmigrantsAfghanistanAfricaAlbaniaArgentinaArmeniaAsiaAustraliaAustriaBahamasBangladeshBarbadosBelarusBelgiumBelizeBoliviaBosnia and HerzegovinaBrazilBulgariaBurma/MyanmarCabo VerdeCambodiaCameroonCanadaCaribbeanCentral AmericaChileChinaColombiaCongoCosta RicaCroatiaCubaCzechoslovakiaDenmarkDominicaDominican RepublicEastern AfricaEastern AsiaEastern EuropeEcuadorEgyptEl SalvadorEnglandEritreaEthiopiaEuropeFijiFranceGermanyGhanaGreeceGrenadaGuatemalaGuyanaHaitiHondurasHong KongHungaryIndiaIndonesiaIranIraqIrelandIsraelItalyJamaicaJapanJordanKazakhstanKenyaKoreaKuwaitLaosLatin AmericaLatviaLebanonLiberiaLithuaniaMalaysiaMexicoMicronesiaMiddle AfricaMoldovaMoroccoNepalNetherlandsNicaraguaNigeriaNorth AmericaNorth MacedoniaNorthern AfricaNorthern EuropeNorwayOceaniaPakistanPanamaPeruPhilippinesPolandPortugalRomaniaRussiaSaudi ArabiaScotlandSenegalSerbiaSierra LeoneSingaporeSomaliaSouth AfricaSouth AmericaSouth Central AsiaSouth Eastern AsiaSouthern EuropeSpainSri LankaSt. Vincent and the GrenadinesSudanSwedenSwitzerlandSyriaTaiwanThailandTrinidad and TobagoTurkeyUgandaUkraineUruguayUzbekistanVenezuelaVietnamWest IndiesWestern AfricaWestern AsiaWestern EuropeYemenZaireZimbabweAzores
Births to Unmarried Women
Income
Poverty
Unemployment
Labor Participation
Family Structure
Vehicle Availability
Education Level
Disability

Births to Unmarried Women Comparison

Paiute

Immigrants from Nepal

Tragic
Exceptional
42.5%
BIRTHS TO UNMARRIED WOMEN
0.0/ 100
METRIC RATING
329th/ 347
METRIC RANK
29.6%
BIRTHS TO UNMARRIED WOMEN
94.3/ 100
METRIC RATING
105th/ 347
METRIC RANK

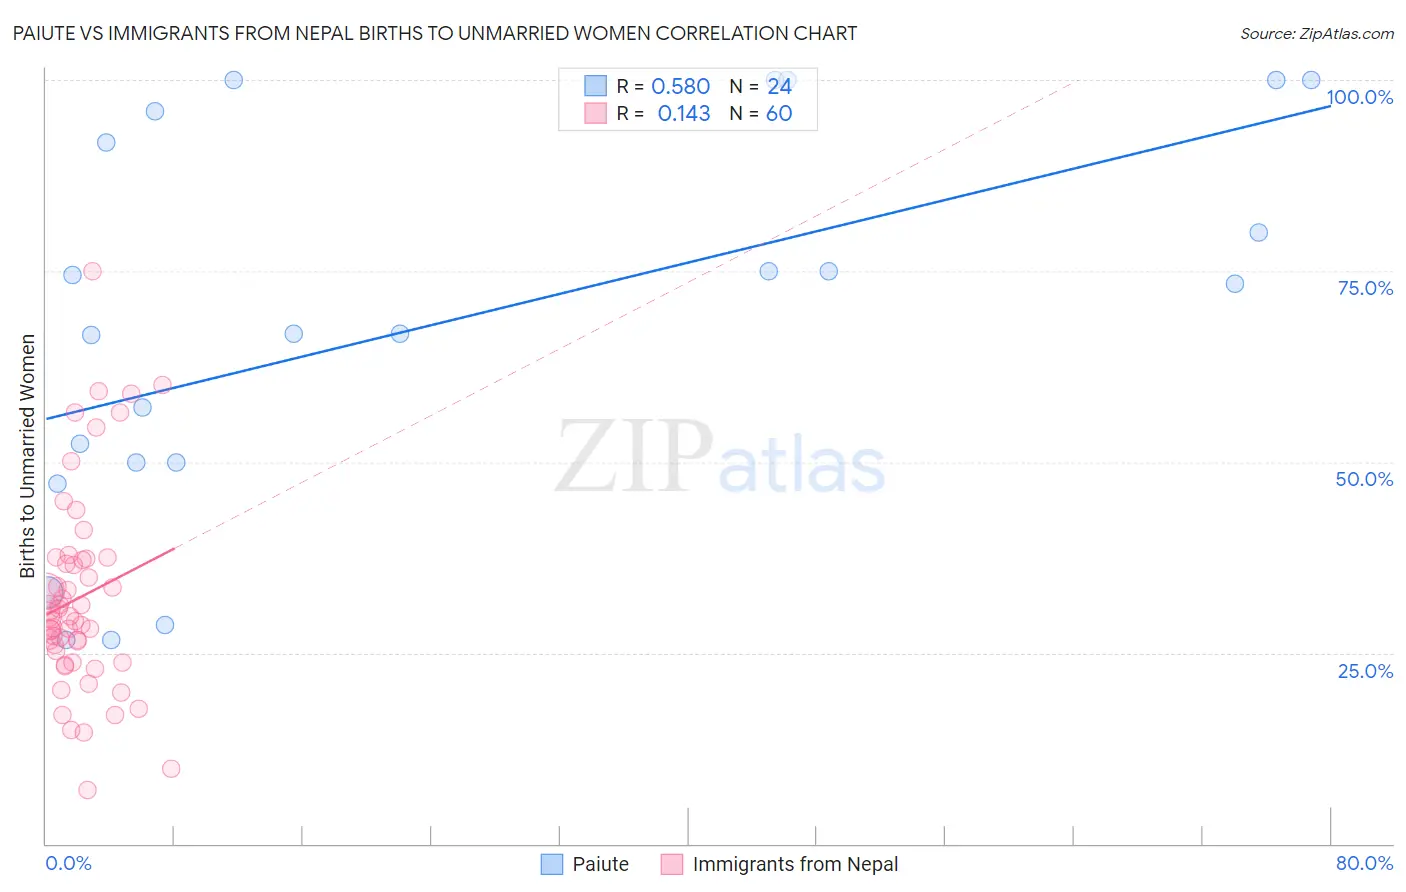
Paiute vs Immigrants from Nepal Births to Unmarried Women Correlation Chart

The statistical analysis conducted on geographies consisting of 57,331,640 people shows a substantial positive correlation between the proportion of Paiute and percentage of births to unmarried women in the United States with a correlation coefficient (R) of 0.580 and weighted average of 42.5%. Similarly, the statistical analysis conducted on geographies consisting of 179,543,863 people shows a poor positive correlation between the proportion of Immigrants from Nepal and percentage of births to unmarried women in the United States with a correlation coefficient (R) of 0.143 and weighted average of 29.6%, a difference of 43.6%.
Paiute vs Immigrants from Nepal Births to Unmarried Women

Births to Unmarried Women Correlation Summary

MeasurementPaiuteImmigrants from Nepal
Minimum26.6%7.1%
Maximum100.0%75.0%
Range73.4%67.9%
Mean68.2%32.2%
Median70.0%29.6%
Interquartile 25% (IQ1)50.0%24.5%
Interquartile 75% (IQ3)93.9%37.3%
Interquartile Range (IQR)43.9%12.8%
Standard Deviation (Sample)25.1%13.2%
Standard Deviation (Population)24.5%13.0%

Similar Demographics by Births to Unmarried Women

Demographics Similar to Paiute by Births to Unmarried Women

In terms of births to unmarried women, the demographic groups most similar to Paiute are Chippewa (42.6%, a difference of 0.40%), Immigrants from Cabo Verde (42.2%, a difference of 0.60%), Tsimshian (42.2%, a difference of 0.74%), Native/Alaskan (43.0%, a difference of 1.2%), and Kiowa (43.1%, a difference of 1.6%).
DemographicsRating | RankBirths to Unmarried Women
Cajuns
0.0
/100
|
#322
Tragic
41.0%
Sioux
0.0
/100
|
#323
Tragic
41.0%
Cape Verdeans
0.0
/100
|
#324
Tragic
41.3%
Cheyenne
0.0
/100
|
#325
Tragic
41.3%
Immigrants | Cuba
0.0
/100
|
#326
Tragic
41.5%
Tsimshian
0.0
/100
|
#327
Tragic
42.2%
Immigrants | Cabo Verde
0.0
/100
|
#328
Tragic
42.2%
Paiute
0.0
/100
|
#329
Tragic
42.5%
Chippewa
0.0
/100
|
#330
Tragic
42.6%
Natives/Alaskans
0.0
/100
|
#331
Tragic
43.0%
Kiowa
0.0
/100
|
#332
Tragic
43.1%
Blacks/African Americans
0.0
/100
|
#333
Tragic
44.3%
Yuman
0.0
/100
|
#334
Tragic
44.4%
Colville
0.0
/100
|
#335
Tragic
45.3%
Puerto Ricans
0.0
/100
|
#336
Tragic
45.7%

Demographics Similar to Immigrants from Nepal by Births to Unmarried Women

In terms of births to unmarried women, the demographic groups most similar to Immigrants from Nepal are Lithuanian (29.6%, a difference of 0.050%), Lebanese (29.5%, a difference of 0.060%), Australian (29.5%, a difference of 0.11%), Immigrants from Northern Africa (29.5%, a difference of 0.19%), and Swedish (29.6%, a difference of 0.25%).
DemographicsRating | RankBirths to Unmarried Women
Immigrants | Syria
95.7
/100
|
#98
Exceptional
29.4%
Immigrants | Denmark
95.3
/100
|
#99
Exceptional
29.4%
Luxembourgers
95.2
/100
|
#100
Exceptional
29.4%
Immigrants | Northern Africa
94.7
/100
|
#101
Exceptional
29.5%
Australians
94.6
/100
|
#102
Exceptional
29.5%
Lebanese
94.4
/100
|
#103
Exceptional
29.5%
Lithuanians
94.4
/100
|
#104
Exceptional
29.6%
Immigrants | Nepal
94.3
/100
|
#105
Exceptional
29.6%
Swedes
93.8
/100
|
#106
Exceptional
29.6%
Immigrants | Brazil
93.7
/100
|
#107
Exceptional
29.6%
Paraguayans
93.5
/100
|
#108
Exceptional
29.7%
Greeks
93.4
/100
|
#109
Exceptional
29.7%
Immigrants | Ethiopia
93.4
/100
|
#110
Exceptional
29.7%
Immigrants | Hungary
93.0
/100
|
#111
Exceptional
29.7%
Basques
93.0
/100
|
#112
Exceptional
29.7%