Osage vs Honduran Average Family Size
COMPARE
Osage
Honduran
Average Family Size
Average Family Size Comparison
Osage
Hondurans
3.18
AVERAGE FAMILY SIZE
3.2/ 100
METRIC RATING
240th/ 347
METRIC RANK
3.35
AVERAGE FAMILY SIZE
100.0/ 100
METRIC RATING
58th/ 347
METRIC RANK
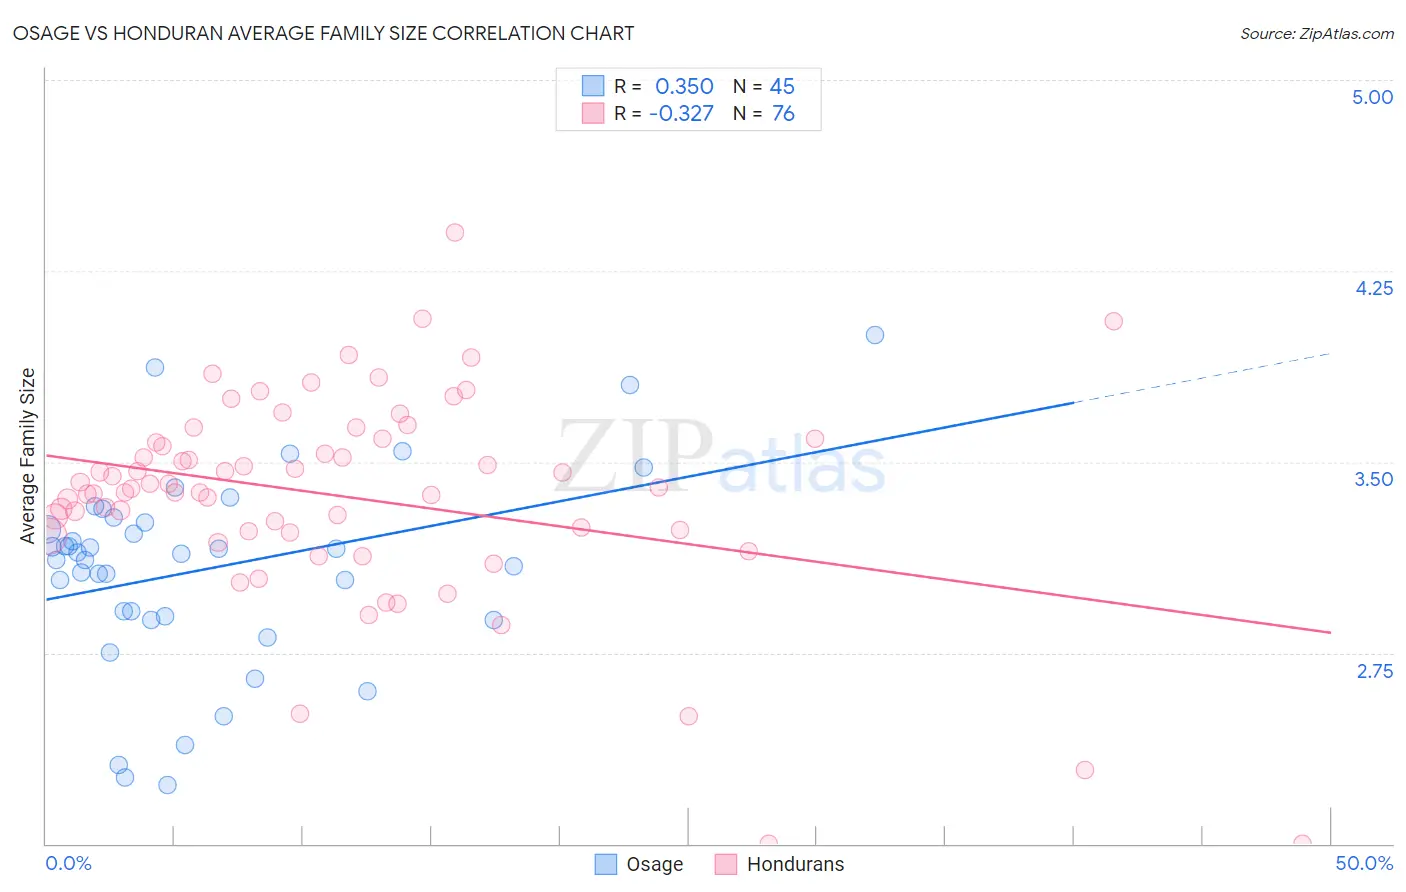
Osage vs Honduran Average Family Size Correlation Chart
The statistical analysis conducted on geographies consisting of 91,797,548 people shows a mild positive correlation between the proportion of Osage and average family size in the United States with a correlation coefficient (R) of 0.350 and weighted average of 3.18. Similarly, the statistical analysis conducted on geographies consisting of 357,606,551 people shows a mild negative correlation between the proportion of Hondurans and average family size in the United States with a correlation coefficient (R) of -0.327 and weighted average of 3.35, a difference of 5.5%.
Average Family Size Correlation Summary
| Measurement | Osage | Honduran |
| Minimum | 2.23 | 2.00 |
| Maximum | 4.00 | 4.40 |
| Range | 1.77 | 2.40 |
| Mean | 3.08 | 3.37 |
| Median | 3.14 | 3.40 |
| Interquartile 25% (IQ1) | 2.89 | 3.23 |
| Interquartile 75% (IQ3) | 3.27 | 3.58 |
| Interquartile Range (IQR) | 0.38 | 0.36 |
| Standard Deviation (Sample) | 0.39 | 0.41 |
| Standard Deviation (Population) | 0.38 | 0.41 |
Similar Demographics by Average Family Size
Demographics Similar to Osage by Average Family Size
In terms of average family size, the demographic groups most similar to Osage are Houma (3.18, a difference of 0.020%), Immigrants from Japan (3.18, a difference of 0.020%), Hungarian (3.18, a difference of 0.040%), Immigrants from Moldova (3.18, a difference of 0.040%), and Immigrants from Southern Europe (3.18, a difference of 0.050%).
| Demographics | Rating | Rank | Average Family Size |
| Brazilians | 4.5 /100 | #233 | Tragic 3.18 |
| Iranians | 4.5 /100 | #234 | Tragic 3.18 |
| Immigrants | Turkey | 4.2 /100 | #235 | Tragic 3.18 |
| Immigrants | Portugal | 4.2 /100 | #236 | Tragic 3.18 |
| Immigrants | Romania | 3.7 /100 | #237 | Tragic 3.18 |
| Romanians | 3.7 /100 | #238 | Tragic 3.18 |
| Houma | 3.4 /100 | #239 | Tragic 3.18 |
| Osage | 3.2 /100 | #240 | Tragic 3.18 |
| Immigrants | Japan | 3.0 /100 | #241 | Tragic 3.18 |
| Hungarians | 3.0 /100 | #242 | Tragic 3.18 |
| Immigrants | Moldova | 2.9 /100 | #243 | Tragic 3.18 |
| Immigrants | Southern Europe | 2.9 /100 | #244 | Tragic 3.18 |
| Immigrants | Brazil | 2.7 /100 | #245 | Tragic 3.18 |
| Danes | 2.5 /100 | #246 | Tragic 3.17 |
| Cajuns | 2.4 /100 | #247 | Tragic 3.17 |
Demographics Similar to Hondurans by Average Family Size
In terms of average family size, the demographic groups most similar to Hondurans are Sri Lankan (3.35, a difference of 0.010%), Immigrants from Dominican Republic (3.35, a difference of 0.060%), Japanese (3.35, a difference of 0.090%), Immigrants from Armenia (3.35, a difference of 0.11%), and Immigrants from Honduras (3.36, a difference of 0.13%).
| Demographics | Rating | Rank | Average Family Size |
| Nicaraguans | 100.0 /100 | #51 | Exceptional 3.36 |
| Fijians | 100.0 /100 | #52 | Exceptional 3.36 |
| Koreans | 100.0 /100 | #53 | Exceptional 3.36 |
| Immigrants | South Eastern Asia | 100.0 /100 | #54 | Exceptional 3.36 |
| Immigrants | Honduras | 100.0 /100 | #55 | Exceptional 3.36 |
| Immigrants | Dominican Republic | 100.0 /100 | #56 | Exceptional 3.35 |
| Sri Lankans | 100.0 /100 | #57 | Exceptional 3.35 |
| Hondurans | 100.0 /100 | #58 | Exceptional 3.35 |
| Japanese | 100.0 /100 | #59 | Exceptional 3.35 |
| Immigrants | Armenia | 100.0 /100 | #60 | Exceptional 3.35 |
| Central American Indians | 100.0 /100 | #61 | Exceptional 3.35 |
| Immigrants | Grenada | 100.0 /100 | #62 | Exceptional 3.34 |
| Chinese | 100.0 /100 | #63 | Exceptional 3.34 |
| Dominicans | 99.9 /100 | #64 | Exceptional 3.34 |
| Immigrants | Laos | 99.9 /100 | #65 | Exceptional 3.34 |