Osage vs Zimbabwean Average Family Size
COMPARE
Osage
Zimbabwean
Average Family Size
Average Family Size Comparison
Osage
Zimbabweans
3.18
AVERAGE FAMILY SIZE
3.2/ 100
METRIC RATING
240th/ 347
METRIC RANK
3.20
AVERAGE FAMILY SIZE
12.6/ 100
METRIC RATING
210th/ 347
METRIC RANK
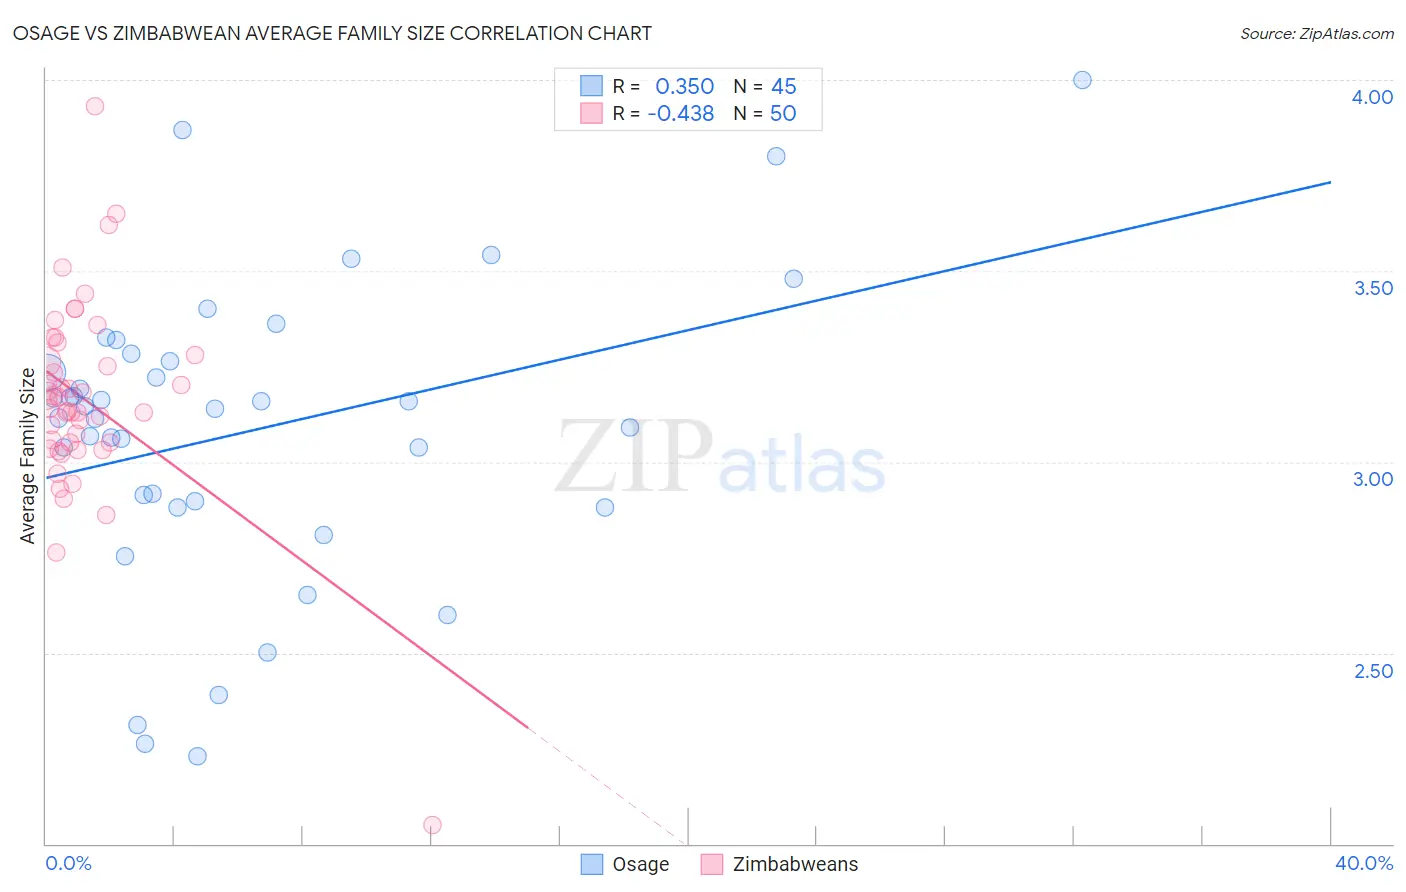
Osage vs Zimbabwean Average Family Size Correlation Chart
The statistical analysis conducted on geographies consisting of 91,797,548 people shows a mild positive correlation between the proportion of Osage and average family size in the United States with a correlation coefficient (R) of 0.350 and weighted average of 3.18. Similarly, the statistical analysis conducted on geographies consisting of 69,189,771 people shows a moderate negative correlation between the proportion of Zimbabweans and average family size in the United States with a correlation coefficient (R) of -0.438 and weighted average of 3.20, a difference of 0.68%.
Average Family Size Correlation Summary
| Measurement | Osage | Zimbabwean |
| Minimum | 2.23 | 2.05 |
| Maximum | 4.00 | 3.93 |
| Range | 1.77 | 1.88 |
| Mean | 3.08 | 3.16 |
| Median | 3.14 | 3.15 |
| Interquartile 25% (IQ1) | 2.89 | 3.05 |
| Interquartile 75% (IQ3) | 3.27 | 3.28 |
| Interquartile Range (IQR) | 0.38 | 0.23 |
| Standard Deviation (Sample) | 0.39 | 0.26 |
| Standard Deviation (Population) | 0.38 | 0.26 |
Similar Demographics by Average Family Size
Demographics Similar to Osage by Average Family Size
In terms of average family size, the demographic groups most similar to Osage are Houma (3.18, a difference of 0.020%), Immigrants from Japan (3.18, a difference of 0.020%), Hungarian (3.18, a difference of 0.040%), Immigrants from Moldova (3.18, a difference of 0.040%), and Immigrants from Southern Europe (3.18, a difference of 0.050%).
| Demographics | Rating | Rank | Average Family Size |
| Brazilians | 4.5 /100 | #233 | Tragic 3.18 |
| Iranians | 4.5 /100 | #234 | Tragic 3.18 |
| Immigrants | Turkey | 4.2 /100 | #235 | Tragic 3.18 |
| Immigrants | Portugal | 4.2 /100 | #236 | Tragic 3.18 |
| Immigrants | Romania | 3.7 /100 | #237 | Tragic 3.18 |
| Romanians | 3.7 /100 | #238 | Tragic 3.18 |
| Houma | 3.4 /100 | #239 | Tragic 3.18 |
| Osage | 3.2 /100 | #240 | Tragic 3.18 |
| Immigrants | Japan | 3.0 /100 | #241 | Tragic 3.18 |
| Hungarians | 3.0 /100 | #242 | Tragic 3.18 |
| Immigrants | Moldova | 2.9 /100 | #243 | Tragic 3.18 |
| Immigrants | Southern Europe | 2.9 /100 | #244 | Tragic 3.18 |
| Immigrants | Brazil | 2.7 /100 | #245 | Tragic 3.18 |
| Danes | 2.5 /100 | #246 | Tragic 3.17 |
| Cajuns | 2.4 /100 | #247 | Tragic 3.17 |
Demographics Similar to Zimbabweans by Average Family Size
In terms of average family size, the demographic groups most similar to Zimbabweans are Immigrants from Iran (3.20, a difference of 0.020%), Creek (3.20, a difference of 0.020%), Chippewa (3.20, a difference of 0.030%), Sudanese (3.20, a difference of 0.030%), and Filipino (3.20, a difference of 0.040%).
| Demographics | Rating | Rank | Average Family Size |
| Immigrants | Nepal | 18.1 /100 | #203 | Poor 3.21 |
| Immigrants | Poland | 16.6 /100 | #204 | Poor 3.20 |
| Paraguayans | 16.3 /100 | #205 | Poor 3.20 |
| Immigrants | Cabo Verde | 16.0 /100 | #206 | Poor 3.20 |
| Filipinos | 13.6 /100 | #207 | Poor 3.20 |
| Chippewa | 13.3 /100 | #208 | Poor 3.20 |
| Sudanese | 13.3 /100 | #209 | Poor 3.20 |
| Zimbabweans | 12.6 /100 | #210 | Poor 3.20 |
| Immigrants | Iran | 12.1 /100 | #211 | Poor 3.20 |
| Creek | 12.1 /100 | #212 | Poor 3.20 |
| Mongolians | 11.5 /100 | #213 | Poor 3.20 |
| Somalis | 11.2 /100 | #214 | Poor 3.20 |
| Delaware | 11.1 /100 | #215 | Poor 3.20 |
| Bermudans | 11.0 /100 | #216 | Poor 3.20 |
| Immigrants | Somalia | 10.3 /100 | #217 | Poor 3.20 |