Northern European vs Kenyan Married-couple Households
COMPARE
Northern European
Kenyan
Married-couple Households
Married-couple Households Comparison
Northern Europeans
Kenyans
48.4%
MARRIED-COUPLE HOUSEHOLDS
99.0/ 100
METRIC RATING
64th/ 347
METRIC RANK
44.7%
MARRIED-COUPLE HOUSEHOLDS
1.7/ 100
METRIC RATING
228th/ 347
METRIC RANK
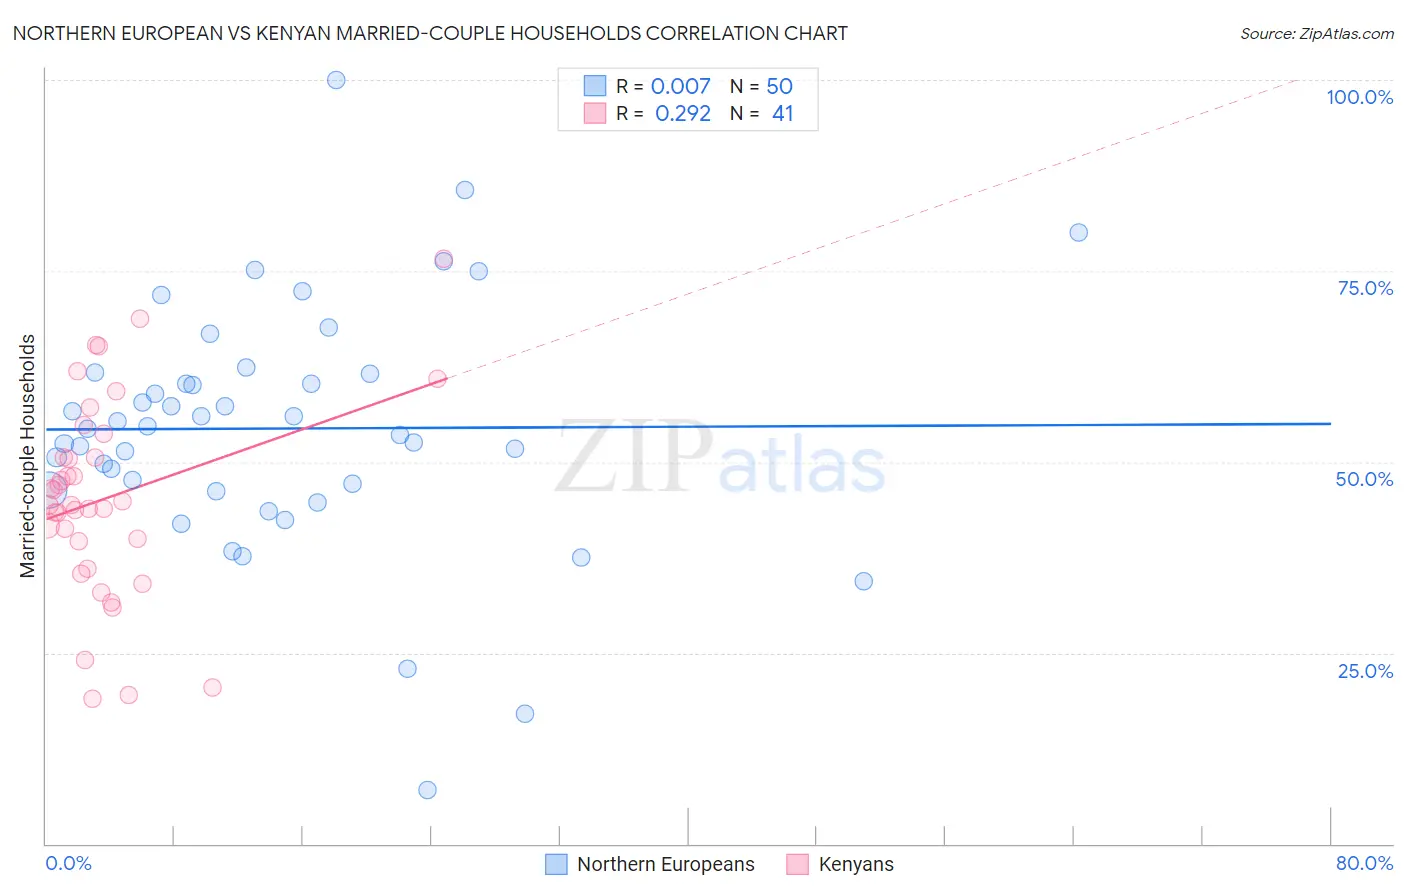
Northern European vs Kenyan Married-couple Households Correlation Chart
The statistical analysis conducted on geographies consisting of 405,935,779 people shows no correlation between the proportion of Northern Europeans and percentage of married-couple family households in the United States with a correlation coefficient (R) of 0.007 and weighted average of 48.4%. Similarly, the statistical analysis conducted on geographies consisting of 168,165,214 people shows a weak positive correlation between the proportion of Kenyans and percentage of married-couple family households in the United States with a correlation coefficient (R) of 0.292 and weighted average of 44.7%, a difference of 8.4%.
Married-couple Households Correlation Summary
| Measurement | Northern European | Kenyan |
| Minimum | 7.1% | 18.9% |
| Maximum | 100.0% | 76.7% |
| Range | 92.9% | 57.7% |
| Mean | 54.4% | 45.3% |
| Median | 54.5% | 44.4% |
| Interquartile 25% (IQ1) | 46.4% | 37.8% |
| Interquartile 75% (IQ3) | 61.6% | 52.2% |
| Interquartile Range (IQR) | 15.2% | 14.4% |
| Standard Deviation (Sample) | 16.3% | 13.1% |
| Standard Deviation (Population) | 16.1% | 12.9% |
Similar Demographics by Married-couple Households
Demographics Similar to Northern Europeans by Married-couple Households
In terms of married-couple households, the demographic groups most similar to Northern Europeans are Basque (48.4%, a difference of 0.010%), Immigrants from Canada (48.4%, a difference of 0.020%), Jordanian (48.4%, a difference of 0.040%), Romanian (48.4%, a difference of 0.050%), and Immigrants from South Eastern Asia (48.4%, a difference of 0.060%).
| Demographics | Rating | Rank | Married-couple Households |
| Poles | 99.2 /100 | #57 | Exceptional 48.5% |
| Immigrants | Indonesia | 99.2 /100 | #58 | Exceptional 48.5% |
| Czechoslovakians | 99.2 /100 | #59 | Exceptional 48.5% |
| Croatians | 99.1 /100 | #60 | Exceptional 48.5% |
| Bulgarians | 99.1 /100 | #61 | Exceptional 48.5% |
| Luxembourgers | 99.1 /100 | #62 | Exceptional 48.5% |
| Basques | 99.0 /100 | #63 | Exceptional 48.4% |
| Northern Europeans | 99.0 /100 | #64 | Exceptional 48.4% |
| Immigrants | Canada | 99.0 /100 | #65 | Exceptional 48.4% |
| Jordanians | 98.9 /100 | #66 | Exceptional 48.4% |
| Romanians | 98.9 /100 | #67 | Exceptional 48.4% |
| Immigrants | South Eastern Asia | 98.9 /100 | #68 | Exceptional 48.4% |
| Immigrants | China | 98.9 /100 | #69 | Exceptional 48.4% |
| Immigrants | North America | 98.9 /100 | #70 | Exceptional 48.4% |
| Laotians | 98.8 /100 | #71 | Exceptional 48.4% |
Demographics Similar to Kenyans by Married-couple Households
In terms of married-couple households, the demographic groups most similar to Kenyans are Immigrants from Latin America (44.7%, a difference of 0.050%), Soviet Union (44.6%, a difference of 0.090%), Houma (44.6%, a difference of 0.10%), Marshallese (44.6%, a difference of 0.10%), and Salvadoran (44.7%, a difference of 0.13%).
| Demographics | Rating | Rank | Married-couple Households |
| Tlingit-Haida | 4.9 /100 | #221 | Tragic 45.1% |
| Immigrants | Laos | 4.6 /100 | #222 | Tragic 45.1% |
| Immigrants | Cambodia | 2.7 /100 | #223 | Tragic 44.9% |
| Immigrants | Micronesia | 2.6 /100 | #224 | Tragic 44.9% |
| Dutch West Indians | 2.6 /100 | #225 | Tragic 44.9% |
| Alsatians | 2.3 /100 | #226 | Tragic 44.8% |
| Salvadorans | 1.9 /100 | #227 | Tragic 44.7% |
| Kenyans | 1.7 /100 | #228 | Tragic 44.7% |
| Immigrants | Latin America | 1.6 /100 | #229 | Tragic 44.7% |
| Soviet Union | 1.6 /100 | #230 | Tragic 44.6% |
| Houma | 1.5 /100 | #231 | Tragic 44.6% |
| Marshallese | 1.5 /100 | #232 | Tragic 44.6% |
| Immigrants | Uganda | 1.5 /100 | #233 | Tragic 44.6% |
| Immigrants | Panama | 1.3 /100 | #234 | Tragic 44.6% |
| Immigrants | Nicaragua | 1.2 /100 | #235 | Tragic 44.5% |