Somali vs Immigrants from Cabo Verde Family Households
COMPARE
Somali
Immigrants from Cabo Verde
Family Households
Family Households Comparison
Somalis
Immigrants from Cabo Verde
57.6%
FAMILY HOUSEHOLDS
0.0/ 100
METRIC RATING
346th/ 347
METRIC RANK
61.9%
FAMILY HOUSEHOLDS
0.0/ 100
METRIC RATING
314th/ 347
METRIC RANK
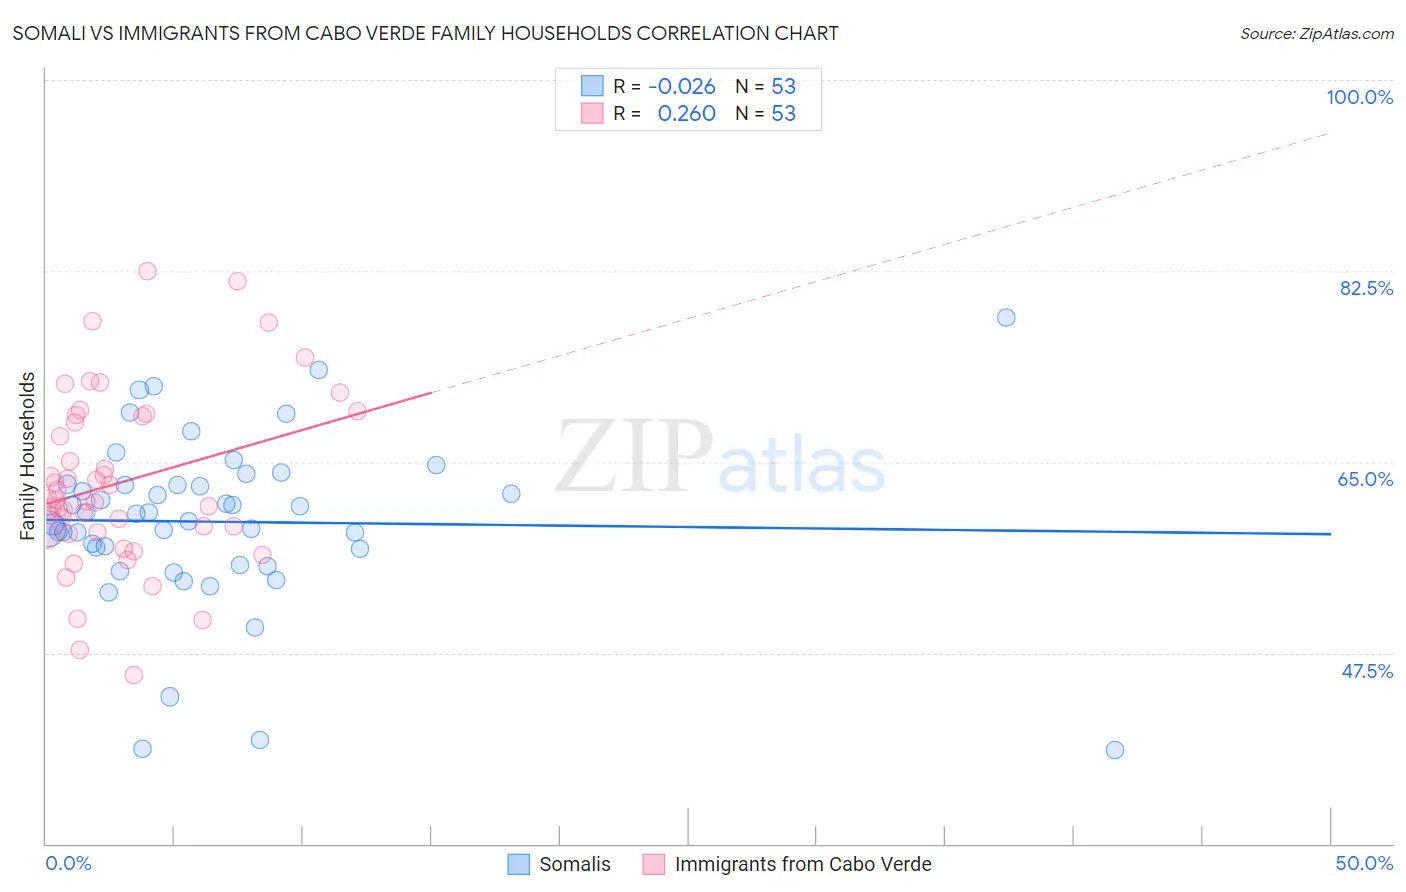
Somali vs Immigrants from Cabo Verde Family Households Correlation Chart
The statistical analysis conducted on geographies consisting of 99,263,237 people shows no correlation between the proportion of Somalis and percentage of family households in the United States with a correlation coefficient (R) of -0.026 and weighted average of 57.6%. Similarly, the statistical analysis conducted on geographies consisting of 38,135,369 people shows a weak positive correlation between the proportion of Immigrants from Cabo Verde and percentage of family households in the United States with a correlation coefficient (R) of 0.260 and weighted average of 61.9%, a difference of 7.4%.
Family Households Correlation Summary
| Measurement | Somali | Immigrants from Cabo Verde |
| Minimum | 38.6% | 45.5% |
| Maximum | 78.2% | 82.5% |
| Range | 39.6% | 37.0% |
| Mean | 59.5% | 63.1% |
| Median | 60.2% | 61.5% |
| Interquartile 25% (IQ1) | 56.3% | 58.5% |
| Interquartile 75% (IQ3) | 62.9% | 69.2% |
| Interquartile Range (IQR) | 6.6% | 10.8% |
| Standard Deviation (Sample) | 7.8% | 7.9% |
| Standard Deviation (Population) | 7.8% | 7.9% |
Similar Demographics by Family Households
Demographics Similar to Somalis by Family Households
In terms of family households, the demographic groups most similar to Somalis are Immigrants from Somalia (56.7%, a difference of 1.7%), Immigrants from Zaire (59.2%, a difference of 2.6%), Immigrants from Congo (59.2%, a difference of 2.8%), Senegalese (59.8%, a difference of 3.8%), and Sudanese (60.0%, a difference of 4.1%).
| Demographics | Rating | Rank | Family Households |
| Immigrants | Ethiopia | 0.0 /100 | #333 | Tragic 61.2% |
| Immigrants | Eastern Africa | 0.0 /100 | #334 | Tragic 61.1% |
| Carpatho Rusyns | 0.0 /100 | #335 | Tragic 61.1% |
| German Russians | 0.0 /100 | #336 | Tragic 60.9% |
| Soviet Union | 0.0 /100 | #337 | Tragic 60.9% |
| Immigrants | Eritrea | 0.0 /100 | #338 | Tragic 60.8% |
| Immigrants | Saudi Arabia | 0.0 /100 | #339 | Tragic 60.7% |
| Immigrants | Sudan | 0.0 /100 | #340 | Tragic 60.2% |
| Immigrants | Senegal | 0.0 /100 | #341 | Tragic 60.1% |
| Sudanese | 0.0 /100 | #342 | Tragic 60.0% |
| Senegalese | 0.0 /100 | #343 | Tragic 59.8% |
| Immigrants | Congo | 0.0 /100 | #344 | Tragic 59.2% |
| Immigrants | Zaire | 0.0 /100 | #345 | Tragic 59.2% |
| Somalis | 0.0 /100 | #346 | Tragic 57.6% |
| Immigrants | Somalia | 0.0 /100 | #347 | Tragic 56.7% |
Demographics Similar to Immigrants from Cabo Verde by Family Households
In terms of family households, the demographic groups most similar to Immigrants from Cabo Verde are Moroccan (61.9%, a difference of 0.040%), Liberian (62.0%, a difference of 0.050%), Immigrants from Latvia (62.0%, a difference of 0.060%), Immigrants from Middle Africa (61.9%, a difference of 0.080%), and Immigrants from Morocco (62.0%, a difference of 0.10%).
| Demographics | Rating | Rank | Family Households |
| Immigrants | Norway | 0.0 /100 | #307 | Tragic 62.1% |
| Chippewa | 0.0 /100 | #308 | Tragic 62.1% |
| Sub-Saharan Africans | 0.0 /100 | #309 | Tragic 62.1% |
| Immigrants | Liberia | 0.0 /100 | #310 | Tragic 62.0% |
| Immigrants | Morocco | 0.0 /100 | #311 | Tragic 62.0% |
| Immigrants | Latvia | 0.0 /100 | #312 | Tragic 62.0% |
| Liberians | 0.0 /100 | #313 | Tragic 62.0% |
| Immigrants | Cabo Verde | 0.0 /100 | #314 | Tragic 61.9% |
| Moroccans | 0.0 /100 | #315 | Tragic 61.9% |
| Immigrants | Middle Africa | 0.0 /100 | #316 | Tragic 61.9% |
| Immigrants | Bosnia and Herzegovina | 0.0 /100 | #317 | Tragic 61.9% |
| Alaskan Athabascans | 0.0 /100 | #318 | Tragic 61.8% |
| Cape Verdeans | 0.0 /100 | #319 | Tragic 61.8% |
| Ugandans | 0.0 /100 | #320 | Tragic 61.7% |
| Alsatians | 0.0 /100 | #321 | Tragic 61.7% |