Guamanian/Chamorro vs Immigrants from Cabo Verde Family Households
COMPARE
Guamanian/Chamorro
Immigrants from Cabo Verde
Family Households
Family Households Comparison
Guamanians/Chamorros
Immigrants from Cabo Verde
66.6%
FAMILY HOUSEHOLDS
100.0/ 100
METRIC RATING
40th/ 347
METRIC RANK
61.9%
FAMILY HOUSEHOLDS
0.0/ 100
METRIC RATING
314th/ 347
METRIC RANK
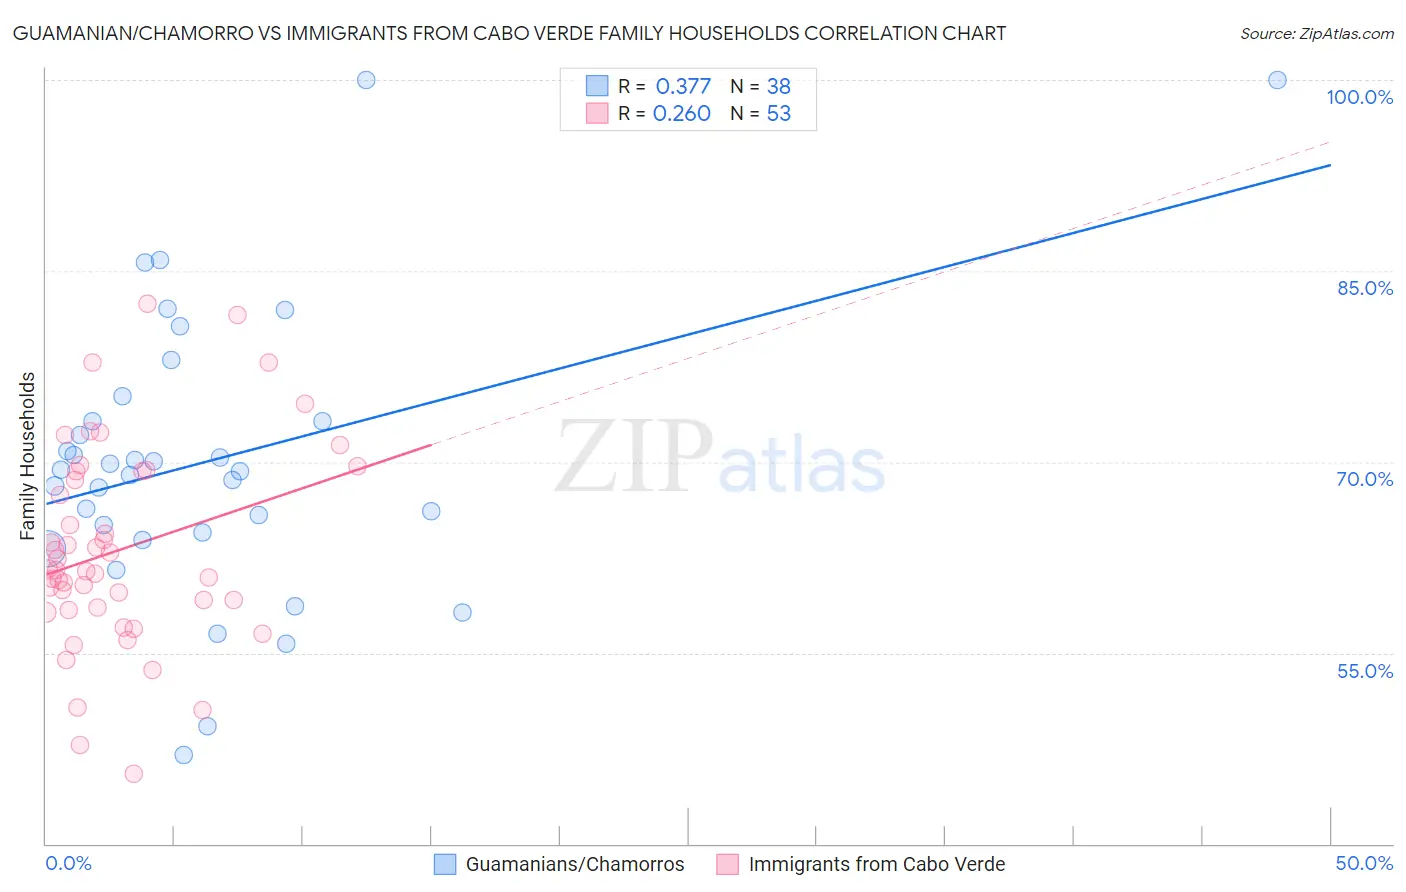
Guamanian/Chamorro vs Immigrants from Cabo Verde Family Households Correlation Chart
The statistical analysis conducted on geographies consisting of 221,865,945 people shows a mild positive correlation between the proportion of Guamanians/Chamorros and percentage of family households in the United States with a correlation coefficient (R) of 0.377 and weighted average of 66.6%. Similarly, the statistical analysis conducted on geographies consisting of 38,135,369 people shows a weak positive correlation between the proportion of Immigrants from Cabo Verde and percentage of family households in the United States with a correlation coefficient (R) of 0.260 and weighted average of 61.9%, a difference of 7.5%.
Family Households Correlation Summary
| Measurement | Guamanian/Chamorro | Immigrants from Cabo Verde |
| Minimum | 47.0% | 45.5% |
| Maximum | 100.0% | 82.5% |
| Range | 53.0% | 37.0% |
| Mean | 70.1% | 63.1% |
| Median | 69.3% | 61.5% |
| Interquartile 25% (IQ1) | 64.4% | 58.5% |
| Interquartile 75% (IQ3) | 73.2% | 69.2% |
| Interquartile Range (IQR) | 8.8% | 10.8% |
| Standard Deviation (Sample) | 11.3% | 7.9% |
| Standard Deviation (Population) | 11.1% | 7.9% |
Similar Demographics by Family Households
Demographics Similar to Guamanians/Chamorros by Family Households
In terms of family households, the demographic groups most similar to Guamanians/Chamorros are Immigrants from Bolivia (66.6%, a difference of 0.030%), Menominee (66.5%, a difference of 0.090%), Apache (66.5%, a difference of 0.10%), Asian (66.5%, a difference of 0.15%), and Venezuelan (66.5%, a difference of 0.17%).
| Demographics | Rating | Rank | Family Households |
| Salvadorans | 100.0 /100 | #33 | Exceptional 67.2% |
| Thais | 100.0 /100 | #34 | Exceptional 67.2% |
| Tohono O'odham | 100.0 /100 | #35 | Exceptional 67.1% |
| Peruvians | 100.0 /100 | #36 | Exceptional 67.1% |
| Tsimshian | 100.0 /100 | #37 | Exceptional 67.1% |
| Mexican American Indians | 100.0 /100 | #38 | Exceptional 67.0% |
| Immigrants | El Salvador | 100.0 /100 | #39 | Exceptional 67.0% |
| Guamanians/Chamorros | 100.0 /100 | #40 | Exceptional 66.6% |
| Immigrants | Bolivia | 100.0 /100 | #41 | Exceptional 66.6% |
| Menominee | 100.0 /100 | #42 | Exceptional 66.5% |
| Apache | 100.0 /100 | #43 | Exceptional 66.5% |
| Asians | 100.0 /100 | #44 | Exceptional 66.5% |
| Venezuelans | 100.0 /100 | #45 | Exceptional 66.5% |
| Arapaho | 100.0 /100 | #46 | Exceptional 66.5% |
| Bolivians | 100.0 /100 | #47 | Exceptional 66.5% |
Demographics Similar to Immigrants from Cabo Verde by Family Households
In terms of family households, the demographic groups most similar to Immigrants from Cabo Verde are Moroccan (61.9%, a difference of 0.040%), Liberian (62.0%, a difference of 0.050%), Immigrants from Latvia (62.0%, a difference of 0.060%), Immigrants from Middle Africa (61.9%, a difference of 0.080%), and Immigrants from Morocco (62.0%, a difference of 0.10%).
| Demographics | Rating | Rank | Family Households |
| Immigrants | Norway | 0.0 /100 | #307 | Tragic 62.1% |
| Chippewa | 0.0 /100 | #308 | Tragic 62.1% |
| Sub-Saharan Africans | 0.0 /100 | #309 | Tragic 62.1% |
| Immigrants | Liberia | 0.0 /100 | #310 | Tragic 62.0% |
| Immigrants | Morocco | 0.0 /100 | #311 | Tragic 62.0% |
| Immigrants | Latvia | 0.0 /100 | #312 | Tragic 62.0% |
| Liberians | 0.0 /100 | #313 | Tragic 62.0% |
| Immigrants | Cabo Verde | 0.0 /100 | #314 | Tragic 61.9% |
| Moroccans | 0.0 /100 | #315 | Tragic 61.9% |
| Immigrants | Middle Africa | 0.0 /100 | #316 | Tragic 61.9% |
| Immigrants | Bosnia and Herzegovina | 0.0 /100 | #317 | Tragic 61.9% |
| Alaskan Athabascans | 0.0 /100 | #318 | Tragic 61.8% |
| Cape Verdeans | 0.0 /100 | #319 | Tragic 61.8% |
| Ugandans | 0.0 /100 | #320 | Tragic 61.7% |
| Alsatians | 0.0 /100 | #321 | Tragic 61.7% |