Nigerian vs Immigrants from Portugal Family Households
COMPARE
Nigerian
Immigrants from Portugal
Family Households
Family Households Comparison
Nigerians
Immigrants from Portugal
63.9%
FAMILY HOUSEHOLDS
11.5/ 100
METRIC RATING
207th/ 347
METRIC RANK
65.2%
FAMILY HOUSEHOLDS
98.6/ 100
METRIC RATING
95th/ 347
METRIC RANK
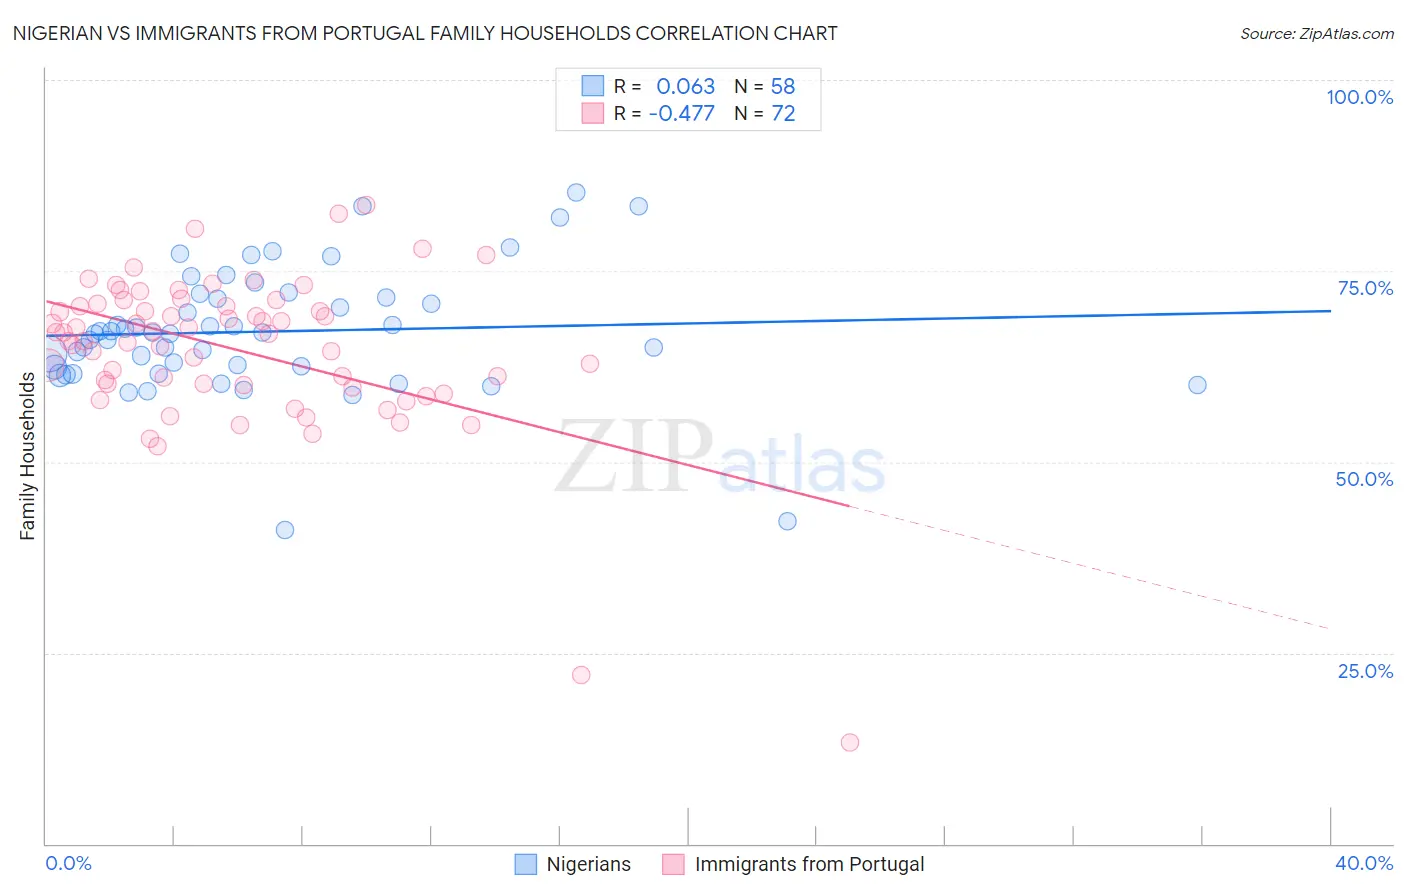
Nigerian vs Immigrants from Portugal Family Households Correlation Chart
The statistical analysis conducted on geographies consisting of 332,466,874 people shows a slight positive correlation between the proportion of Nigerians and percentage of family households in the United States with a correlation coefficient (R) of 0.063 and weighted average of 63.9%. Similarly, the statistical analysis conducted on geographies consisting of 174,766,633 people shows a moderate negative correlation between the proportion of Immigrants from Portugal and percentage of family households in the United States with a correlation coefficient (R) of -0.477 and weighted average of 65.2%, a difference of 2.1%.
Family Households Correlation Summary
| Measurement | Nigerian | Immigrants from Portugal |
| Minimum | 41.2% | 13.2% |
| Maximum | 85.2% | 83.6% |
| Range | 44.1% | 70.4% |
| Mean | 67.1% | 64.7% |
| Median | 66.9% | 66.8% |
| Interquartile 25% (IQ1) | 62.4% | 60.1% |
| Interquartile 75% (IQ3) | 71.6% | 70.5% |
| Interquartile Range (IQR) | 9.2% | 10.4% |
| Standard Deviation (Sample) | 8.2% | 10.7% |
| Standard Deviation (Population) | 8.2% | 10.6% |
Similar Demographics by Family Households
Demographics Similar to Nigerians by Family Households
In terms of family households, the demographic groups most similar to Nigerians are Immigrants from Bangladesh (63.9%, a difference of 0.0%), Sierra Leonean (63.9%, a difference of 0.010%), Immigrants from Lithuania (63.9%, a difference of 0.020%), Brazilian (63.9%, a difference of 0.030%), and Immigrants from Uruguay (63.9%, a difference of 0.040%).
| Demographics | Rating | Rank | Family Households |
| Immigrants | Malaysia | 17.9 /100 | #200 | Poor 64.0% |
| Immigrants | Eastern Europe | 17.2 /100 | #201 | Poor 64.0% |
| Iranians | 13.5 /100 | #202 | Poor 63.9% |
| Norwegians | 13.2 /100 | #203 | Poor 63.9% |
| Immigrants | Uruguay | 12.8 /100 | #204 | Poor 63.9% |
| Brazilians | 12.4 /100 | #205 | Poor 63.9% |
| Immigrants | Lithuania | 12.1 /100 | #206 | Poor 63.9% |
| Nigerians | 11.5 /100 | #207 | Poor 63.9% |
| Immigrants | Bangladesh | 11.4 /100 | #208 | Poor 63.9% |
| Sierra Leoneans | 11.2 /100 | #209 | Poor 63.9% |
| Immigrants | Thailand | 9.6 /100 | #210 | Tragic 63.8% |
| Shoshone | 9.4 /100 | #211 | Tragic 63.8% |
| Immigrants | Netherlands | 9.4 /100 | #212 | Tragic 63.8% |
| Immigrants | Northern Europe | 8.8 /100 | #213 | Tragic 63.8% |
| Celtics | 8.0 /100 | #214 | Tragic 63.8% |
Demographics Similar to Immigrants from Portugal by Family Households
In terms of family households, the demographic groups most similar to Immigrants from Portugal are Swiss (65.2%, a difference of 0.010%), Guatemalan (65.2%, a difference of 0.010%), Immigrants from Poland (65.2%, a difference of 0.030%), Guyanese (65.3%, a difference of 0.040%), and Hopi (65.3%, a difference of 0.050%).
| Demographics | Rating | Rank | Family Households |
| Immigrants | Haiti | 99.1 /100 | #88 | Exceptional 65.3% |
| Immigrants | Caribbean | 99.1 /100 | #89 | Exceptional 65.3% |
| Immigrants | Laos | 99.1 /100 | #90 | Exceptional 65.3% |
| Crow | 98.9 /100 | #91 | Exceptional 65.3% |
| Hopi | 98.8 /100 | #92 | Exceptional 65.3% |
| Guyanese | 98.8 /100 | #93 | Exceptional 65.3% |
| Immigrants | Poland | 98.7 /100 | #94 | Exceptional 65.2% |
| Immigrants | Portugal | 98.6 /100 | #95 | Exceptional 65.2% |
| Swiss | 98.6 /100 | #96 | Exceptional 65.2% |
| Guatemalans | 98.6 /100 | #97 | Exceptional 65.2% |
| Immigrants | Syria | 98.4 /100 | #98 | Exceptional 65.2% |
| Central American Indians | 98.3 /100 | #99 | Exceptional 65.2% |
| Haitians | 98.1 /100 | #100 | Exceptional 65.2% |
| Chileans | 98.1 /100 | #101 | Exceptional 65.2% |
| Immigrants | Sri Lanka | 98.0 /100 | #102 | Exceptional 65.1% |