Italian vs Immigrants from Cabo Verde Family Households
COMPARE
Italian
Immigrants from Cabo Verde
Family Households
Family Households Comparison
Italians
Immigrants from Cabo Verde
64.8%
FAMILY HOUSEHOLDS
91.9/ 100
METRIC RATING
128th/ 347
METRIC RANK
61.9%
FAMILY HOUSEHOLDS
0.0/ 100
METRIC RATING
314th/ 347
METRIC RANK
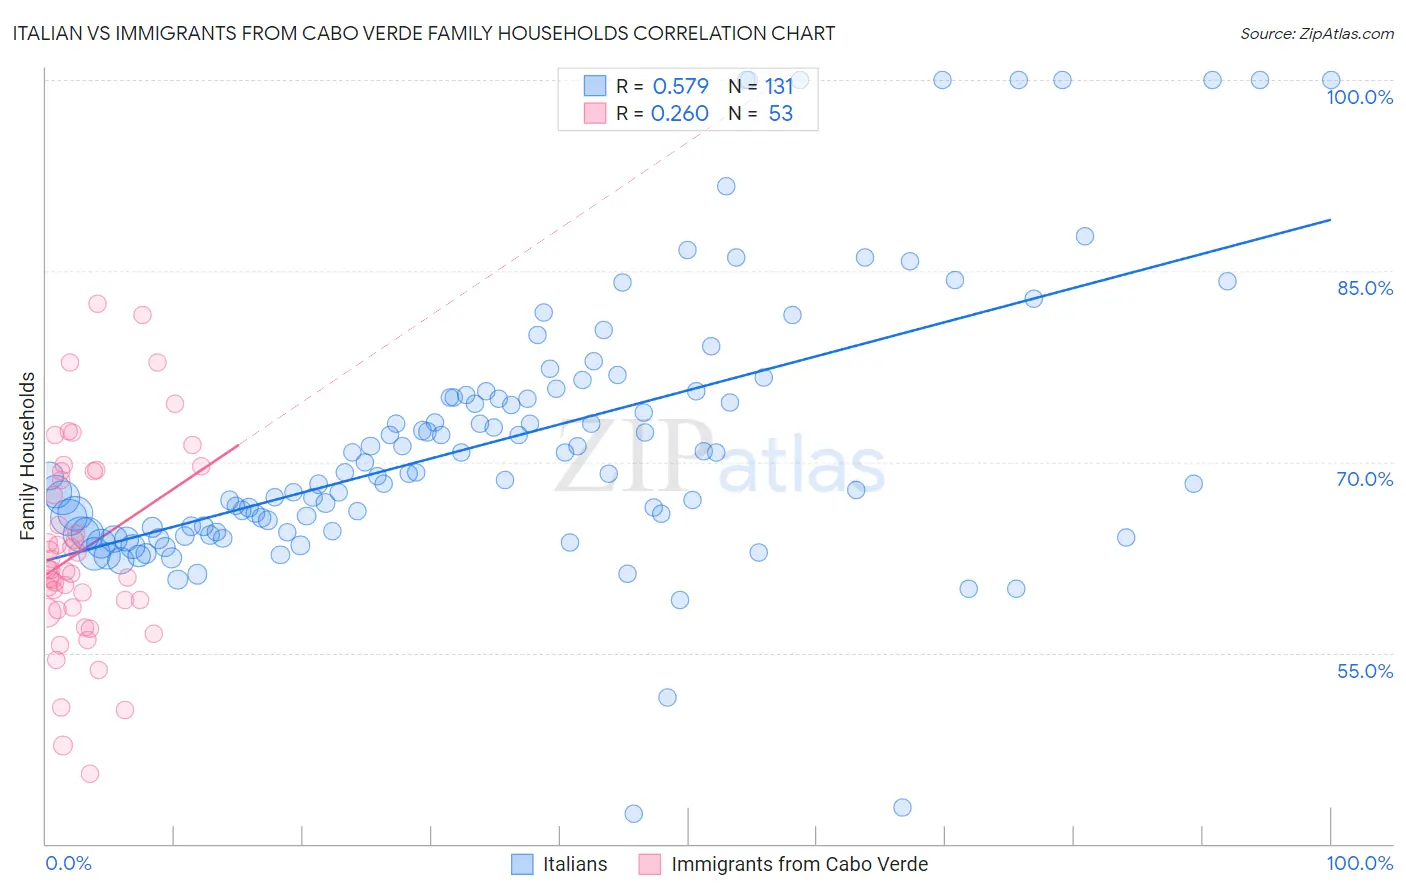
Italian vs Immigrants from Cabo Verde Family Households Correlation Chart
The statistical analysis conducted on geographies consisting of 574,452,488 people shows a substantial positive correlation between the proportion of Italians and percentage of family households in the United States with a correlation coefficient (R) of 0.579 and weighted average of 64.8%. Similarly, the statistical analysis conducted on geographies consisting of 38,135,369 people shows a weak positive correlation between the proportion of Immigrants from Cabo Verde and percentage of family households in the United States with a correlation coefficient (R) of 0.260 and weighted average of 61.9%, a difference of 4.6%.
Family Households Correlation Summary
| Measurement | Italian | Immigrants from Cabo Verde |
| Minimum | 42.4% | 45.5% |
| Maximum | 100.0% | 82.5% |
| Range | 57.6% | 37.0% |
| Mean | 71.7% | 63.1% |
| Median | 69.1% | 61.5% |
| Interquartile 25% (IQ1) | 64.5% | 58.5% |
| Interquartile 75% (IQ3) | 75.2% | 69.2% |
| Interquartile Range (IQR) | 10.7% | 10.8% |
| Standard Deviation (Sample) | 10.9% | 7.9% |
| Standard Deviation (Population) | 10.8% | 7.9% |
Similar Demographics by Family Households
Demographics Similar to Italians by Family Households
In terms of family households, the demographic groups most similar to Italians are Immigrants from Panama (64.8%, a difference of 0.010%), Panamanian (64.8%, a difference of 0.020%), Immigrants from Ecuador (64.8%, a difference of 0.020%), Immigrants from Argentina (64.9%, a difference of 0.040%), and Immigrants from Belize (64.9%, a difference of 0.040%).
| Demographics | Rating | Rank | Family Households |
| Hungarians | 94.0 /100 | #121 | Exceptional 64.9% |
| Hmong | 93.4 /100 | #122 | Exceptional 64.9% |
| Choctaw | 93.4 /100 | #123 | Exceptional 64.9% |
| Immigrants | Argentina | 92.8 /100 | #124 | Exceptional 64.9% |
| Immigrants | Belize | 92.7 /100 | #125 | Exceptional 64.9% |
| Panamanians | 92.4 /100 | #126 | Exceptional 64.8% |
| Immigrants | Panama | 92.0 /100 | #127 | Exceptional 64.8% |
| Italians | 91.9 /100 | #128 | Exceptional 64.8% |
| Immigrants | Ecuador | 91.4 /100 | #129 | Exceptional 64.8% |
| Immigrants | Italy | 90.2 /100 | #130 | Exceptional 64.8% |
| Immigrants | Nonimmigrants | 90.1 /100 | #131 | Exceptional 64.8% |
| Cajuns | 89.4 /100 | #132 | Excellent 64.8% |
| Belizeans | 89.3 /100 | #133 | Excellent 64.8% |
| Greeks | 88.1 /100 | #134 | Excellent 64.7% |
| Maltese | 87.4 /100 | #135 | Excellent 64.7% |
Demographics Similar to Immigrants from Cabo Verde by Family Households
In terms of family households, the demographic groups most similar to Immigrants from Cabo Verde are Moroccan (61.9%, a difference of 0.040%), Liberian (62.0%, a difference of 0.050%), Immigrants from Latvia (62.0%, a difference of 0.060%), Immigrants from Middle Africa (61.9%, a difference of 0.080%), and Immigrants from Morocco (62.0%, a difference of 0.10%).
| Demographics | Rating | Rank | Family Households |
| Immigrants | Norway | 0.0 /100 | #307 | Tragic 62.1% |
| Chippewa | 0.0 /100 | #308 | Tragic 62.1% |
| Sub-Saharan Africans | 0.0 /100 | #309 | Tragic 62.1% |
| Immigrants | Liberia | 0.0 /100 | #310 | Tragic 62.0% |
| Immigrants | Morocco | 0.0 /100 | #311 | Tragic 62.0% |
| Immigrants | Latvia | 0.0 /100 | #312 | Tragic 62.0% |
| Liberians | 0.0 /100 | #313 | Tragic 62.0% |
| Immigrants | Cabo Verde | 0.0 /100 | #314 | Tragic 61.9% |
| Moroccans | 0.0 /100 | #315 | Tragic 61.9% |
| Immigrants | Middle Africa | 0.0 /100 | #316 | Tragic 61.9% |
| Immigrants | Bosnia and Herzegovina | 0.0 /100 | #317 | Tragic 61.9% |
| Alaskan Athabascans | 0.0 /100 | #318 | Tragic 61.8% |
| Cape Verdeans | 0.0 /100 | #319 | Tragic 61.8% |
| Ugandans | 0.0 /100 | #320 | Tragic 61.7% |
| Alsatians | 0.0 /100 | #321 | Tragic 61.7% |