New Zealander vs Pima Births to Unmarried Women
COMPARE
New Zealander
Pima
Births to Unmarried Women
Births to Unmarried Women Comparison
New Zealanders
Pima
30.3%
BIRTHS TO UNMARRIED WOMEN
85.5/ 100
METRIC RATING
132nd/ 347
METRIC RANK
51.5%
BIRTHS TO UNMARRIED WOMEN
0.0/ 100
METRIC RATING
343rd/ 347
METRIC RANK
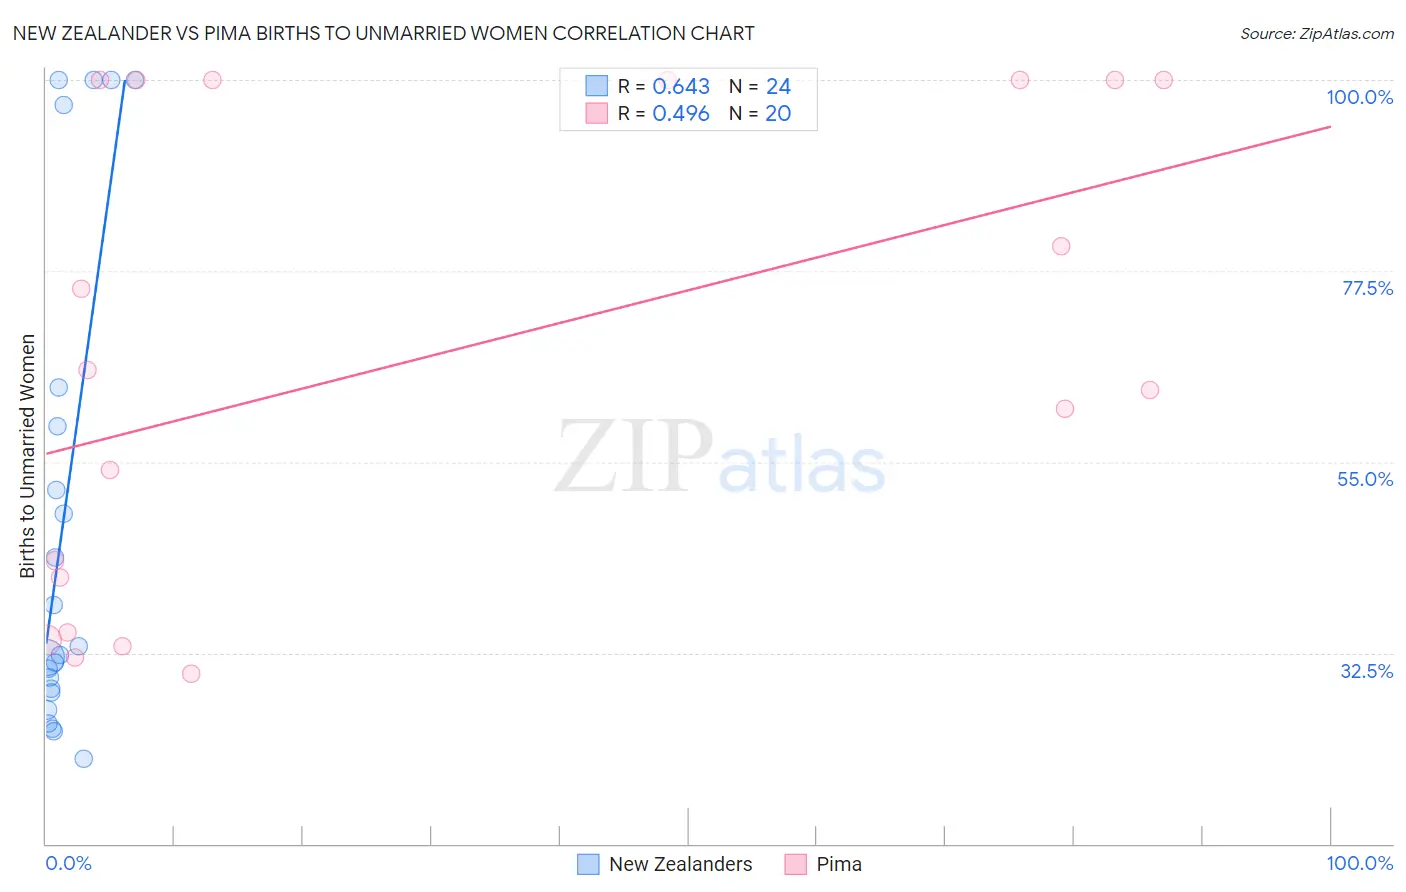
New Zealander vs Pima Births to Unmarried Women Correlation Chart
The statistical analysis conducted on geographies consisting of 103,815,095 people shows a significant positive correlation between the proportion of New Zealanders and percentage of births to unmarried women in the United States with a correlation coefficient (R) of 0.643 and weighted average of 30.3%. Similarly, the statistical analysis conducted on geographies consisting of 60,986,588 people shows a moderate positive correlation between the proportion of Pima and percentage of births to unmarried women in the United States with a correlation coefficient (R) of 0.496 and weighted average of 51.5%, a difference of 69.6%.
Births to Unmarried Women Correlation Summary
| Measurement | New Zealander | Pima |
| Minimum | 20.0% | 30.0% |
| Maximum | 100.0% | 100.0% |
| Range | 80.0% | 70.0% |
| Mean | 48.5% | 67.5% |
| Median | 32.8% | 64.6% |
| Interquartile 25% (IQ1) | 28.0% | 38.1% |
| Interquartile 75% (IQ3) | 61.5% | 100.0% |
| Interquartile Range (IQR) | 33.5% | 61.9% |
| Standard Deviation (Sample) | 28.9% | 28.2% |
| Standard Deviation (Population) | 28.3% | 27.5% |
Similar Demographics by Births to Unmarried Women
Demographics Similar to New Zealanders by Births to Unmarried Women
In terms of births to unmarried women, the demographic groups most similar to New Zealanders are Immigrants from Zimbabwe (30.3%, a difference of 0.030%), Immigrants from Bosnia and Herzegovina (30.3%, a difference of 0.050%), Immigrants from Morocco (30.4%, a difference of 0.050%), Immigrants from Spain (30.3%, a difference of 0.060%), and Immigrants from South Eastern Asia (30.4%, a difference of 0.060%).
| Demographics | Rating | Rank | Births to Unmarried Women |
| Vietnamese | 87.7 /100 | #125 | Excellent 30.2% |
| Europeans | 87.2 /100 | #126 | Excellent 30.2% |
| Chinese | 87.1 /100 | #127 | Excellent 30.2% |
| Icelanders | 86.0 /100 | #128 | Excellent 30.3% |
| Immigrants | Spain | 85.8 /100 | #129 | Excellent 30.3% |
| Immigrants | Bosnia and Herzegovina | 85.7 /100 | #130 | Excellent 30.3% |
| Immigrants | Zimbabwe | 85.7 /100 | #131 | Excellent 30.3% |
| New Zealanders | 85.5 /100 | #132 | Excellent 30.3% |
| Immigrants | Morocco | 85.2 /100 | #133 | Excellent 30.4% |
| Immigrants | South Eastern Asia | 85.2 /100 | #134 | Excellent 30.4% |
| Brazilians | 84.8 /100 | #135 | Excellent 30.4% |
| Immigrants | Scotland | 84.6 /100 | #136 | Excellent 30.4% |
| Immigrants | Philippines | 83.9 /100 | #137 | Excellent 30.4% |
| Puget Sound Salish | 83.9 /100 | #138 | Excellent 30.4% |
| Immigrants | Canada | 83.7 /100 | #139 | Excellent 30.4% |
Demographics Similar to Pima by Births to Unmarried Women
In terms of births to unmarried women, the demographic groups most similar to Pima are Navajo (51.5%, a difference of 0.040%), Menominee (51.1%, a difference of 0.70%), Inupiat (52.1%, a difference of 1.2%), Hopi (50.8%, a difference of 1.3%), and Tohono O'odham (49.8%, a difference of 3.3%).
| Demographics | Rating | Rank | Births to Unmarried Women |
| Blacks/African Americans | 0.0 /100 | #333 | Tragic 44.3% |
| Yuman | 0.0 /100 | #334 | Tragic 44.4% |
| Colville | 0.0 /100 | #335 | Tragic 45.3% |
| Puerto Ricans | 0.0 /100 | #336 | Tragic 45.7% |
| Houma | 0.0 /100 | #337 | Tragic 46.6% |
| Arapaho | 0.0 /100 | #338 | Tragic 47.1% |
| Lumbee | 0.0 /100 | #339 | Tragic 48.2% |
| Tohono O'odham | 0.0 /100 | #340 | Tragic 49.8% |
| Hopi | 0.0 /100 | #341 | Tragic 50.8% |
| Menominee | 0.0 /100 | #342 | Tragic 51.1% |
| Pima | 0.0 /100 | #343 | Tragic 51.5% |
| Navajo | 0.0 /100 | #344 | Tragic 51.5% |
| Inupiat | 0.0 /100 | #345 | Tragic 52.1% |
| Pueblo | 0.0 /100 | #346 | Tragic 53.7% |
| Yup'ik | 0.0 /100 | #347 | Tragic 56.4% |