New Zealander vs Pima Unemployment Among Youth under 25 years
COMPARE
New Zealander
Pima
Unemployment Among Youth under 25 years
Unemployment Among Youth under 25 years Comparison
New Zealanders
Pima
11.2%
UNEMPLOYMENT AMONG YOUTH UNDER 25 YEARS
97.2/ 100
METRIC RATING
74th/ 347
METRIC RANK
16.2%
UNEMPLOYMENT AMONG YOUTH UNDER 25 YEARS
0.0/ 100
METRIC RATING
336th/ 347
METRIC RANK
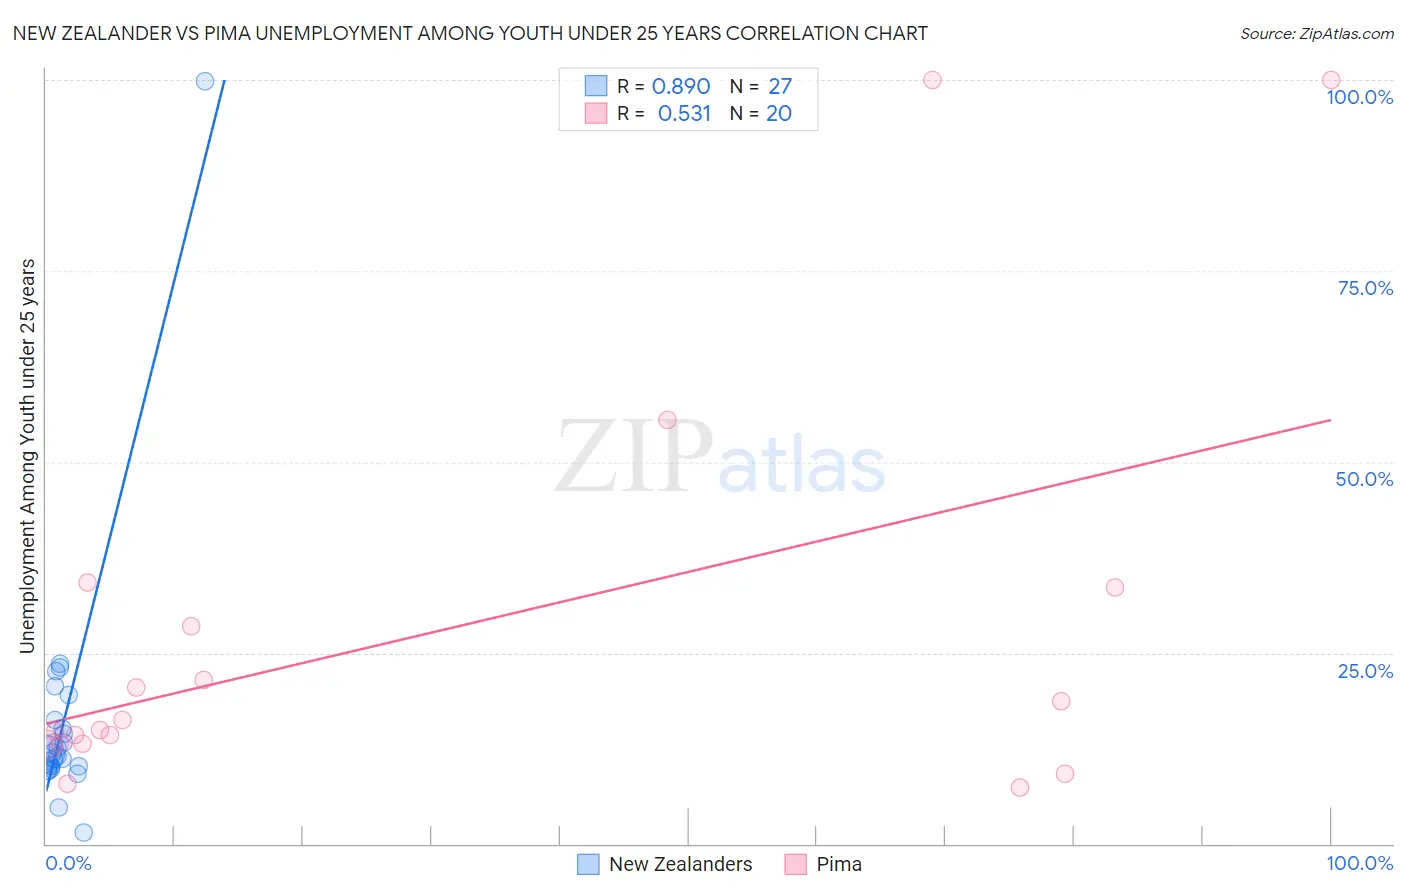
New Zealander vs Pima Unemployment Among Youth under 25 years Correlation Chart
The statistical analysis conducted on geographies consisting of 106,451,215 people shows a very strong positive correlation between the proportion of New Zealanders and unemployment rate among youth under the age of 25 in the United States with a correlation coefficient (R) of 0.890 and weighted average of 11.2%. Similarly, the statistical analysis conducted on geographies consisting of 61,326,088 people shows a substantial positive correlation between the proportion of Pima and unemployment rate among youth under the age of 25 in the United States with a correlation coefficient (R) of 0.531 and weighted average of 16.2%, a difference of 45.3%.
Unemployment Among Youth under 25 years Correlation Summary
| Measurement | New Zealander | Pima |
| Minimum | 1.4% | 7.3% |
| Maximum | 99.9% | 100.0% |
| Range | 98.5% | 92.7% |
| Mean | 16.2% | 27.5% |
| Median | 11.8% | 15.5% |
| Interquartile 25% (IQ1) | 10.1% | 13.1% |
| Interquartile 75% (IQ3) | 16.3% | 30.9% |
| Interquartile Range (IQR) | 6.2% | 17.9% |
| Standard Deviation (Sample) | 17.5% | 27.2% |
| Standard Deviation (Population) | 17.2% | 26.6% |
Similar Demographics by Unemployment Among Youth under 25 years
Demographics Similar to New Zealanders by Unemployment Among Youth under 25 years
In terms of unemployment among youth under 25 years, the demographic groups most similar to New Zealanders are Creek (11.2%, a difference of 0.010%), French (11.2%, a difference of 0.030%), German Russian (11.2%, a difference of 0.050%), Immigrants from Australia (11.2%, a difference of 0.060%), and Bhutanese (11.2%, a difference of 0.10%).
| Demographics | Rating | Rank | Unemployment Among Youth under 25 years |
| Chickasaw | 97.7 /100 | #67 | Exceptional 11.2% |
| Immigrants | Kenya | 97.6 /100 | #68 | Exceptional 11.2% |
| Immigrants | Moldova | 97.5 /100 | #69 | Exceptional 11.2% |
| Slavs | 97.5 /100 | #70 | Exceptional 11.2% |
| Bhutanese | 97.4 /100 | #71 | Exceptional 11.2% |
| Immigrants | Australia | 97.3 /100 | #72 | Exceptional 11.2% |
| Creek | 97.2 /100 | #73 | Exceptional 11.2% |
| New Zealanders | 97.2 /100 | #74 | Exceptional 11.2% |
| French | 97.1 /100 | #75 | Exceptional 11.2% |
| German Russians | 97.0 /100 | #76 | Exceptional 11.2% |
| Whites/Caucasians | 96.9 /100 | #77 | Exceptional 11.2% |
| Immigrants | Nicaragua | 96.7 /100 | #78 | Exceptional 11.2% |
| Immigrants | Canada | 96.7 /100 | #79 | Exceptional 11.2% |
| Immigrants | Bulgaria | 96.4 /100 | #80 | Exceptional 11.2% |
| Icelanders | 96.3 /100 | #81 | Exceptional 11.2% |
Demographics Similar to Pima by Unemployment Among Youth under 25 years
In terms of unemployment among youth under 25 years, the demographic groups most similar to Pima are Arapaho (16.3%, a difference of 0.16%), Yuman (16.3%, a difference of 0.45%), Immigrants from St. Vincent and the Grenadines (16.1%, a difference of 0.64%), Tsimshian (16.5%, a difference of 1.5%), and Immigrants from Guyana (15.9%, a difference of 1.9%).
| Demographics | Rating | Rank | Unemployment Among Youth under 25 years |
| Immigrants | Yemen | 0.0 /100 | #329 | Tragic 15.6% |
| Yakama | 0.0 /100 | #330 | Tragic 15.6% |
| Dominicans | 0.0 /100 | #331 | Tragic 15.7% |
| Immigrants | Grenada | 0.0 /100 | #332 | Tragic 15.8% |
| Guyanese | 0.0 /100 | #333 | Tragic 15.9% |
| Immigrants | Guyana | 0.0 /100 | #334 | Tragic 15.9% |
| Immigrants | St. Vincent and the Grenadines | 0.0 /100 | #335 | Tragic 16.1% |
| Pima | 0.0 /100 | #336 | Tragic 16.2% |
| Arapaho | 0.0 /100 | #337 | Tragic 16.3% |
| Yuman | 0.0 /100 | #338 | Tragic 16.3% |
| Tsimshian | 0.0 /100 | #339 | Tragic 16.5% |
| Colville | 0.0 /100 | #340 | Tragic 16.8% |
| Paiute | 0.0 /100 | #341 | Tragic 17.6% |
| Puerto Ricans | 0.0 /100 | #342 | Tragic 18.4% |
| Navajo | 0.0 /100 | #343 | Tragic 18.6% |