Cajun vs Pima Births to Unmarried Women
COMPARE
Cajun
Pima
Births to Unmarried Women
Births to Unmarried Women Comparison
Cajuns
Pima
41.0%
BIRTHS TO UNMARRIED WOMEN
0.0/ 100
METRIC RATING
322nd/ 347
METRIC RANK
51.5%
BIRTHS TO UNMARRIED WOMEN
0.0/ 100
METRIC RATING
343rd/ 347
METRIC RANK
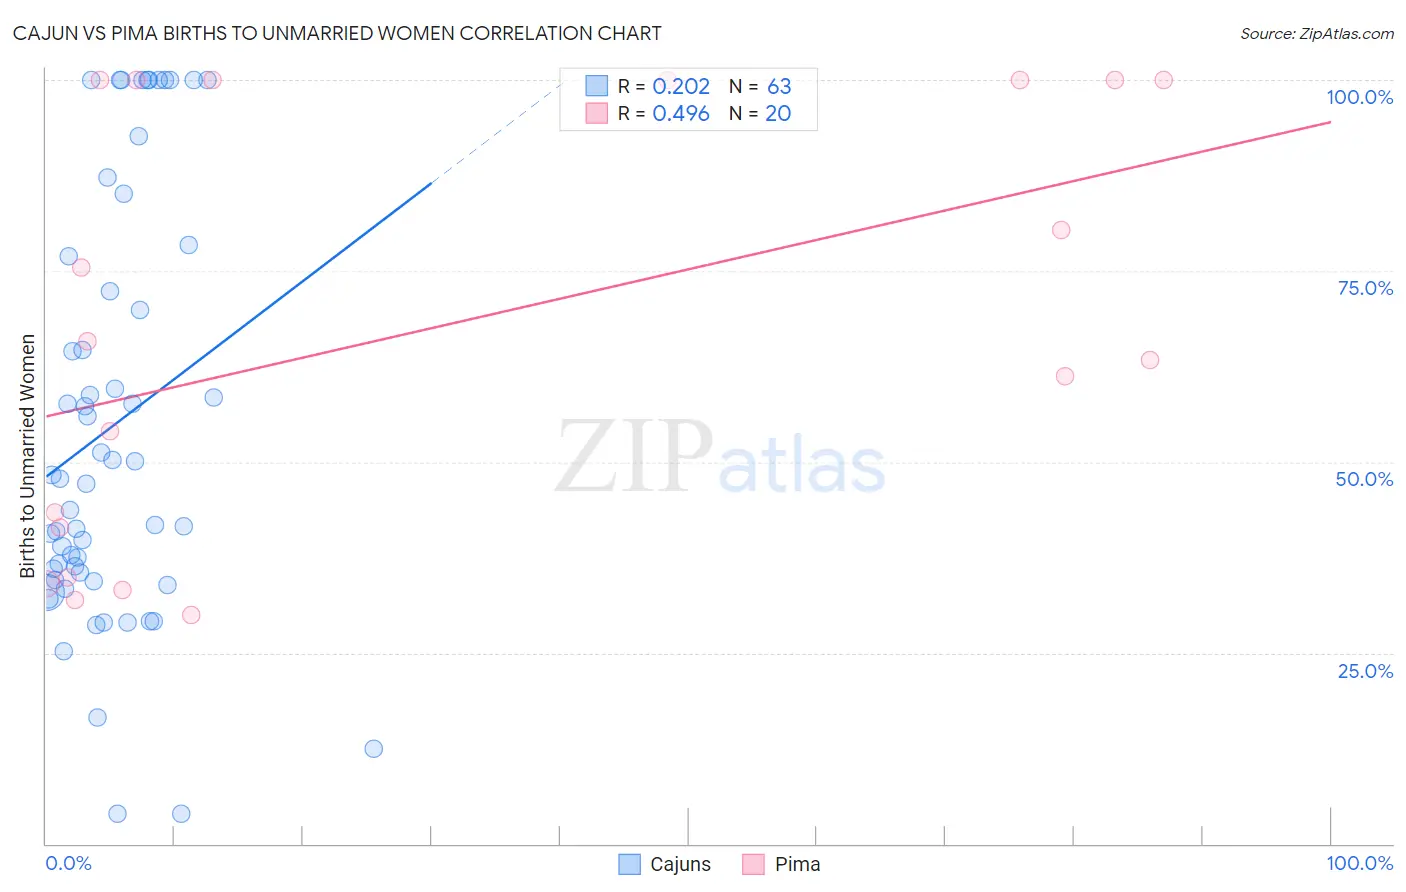
Cajun vs Pima Births to Unmarried Women Correlation Chart
The statistical analysis conducted on geographies consisting of 144,039,196 people shows a weak positive correlation between the proportion of Cajuns and percentage of births to unmarried women in the United States with a correlation coefficient (R) of 0.202 and weighted average of 41.0%. Similarly, the statistical analysis conducted on geographies consisting of 60,986,588 people shows a moderate positive correlation between the proportion of Pima and percentage of births to unmarried women in the United States with a correlation coefficient (R) of 0.496 and weighted average of 51.5%, a difference of 25.7%.
Births to Unmarried Women Correlation Summary
| Measurement | Cajun | Pima |
| Minimum | 4.0% | 30.0% |
| Maximum | 100.0% | 100.0% |
| Range | 96.0% | 70.0% |
| Mean | 54.7% | 67.5% |
| Median | 47.8% | 64.6% |
| Interquartile 25% (IQ1) | 34.6% | 38.1% |
| Interquartile 75% (IQ3) | 76.9% | 100.0% |
| Interquartile Range (IQR) | 42.3% | 61.9% |
| Standard Deviation (Sample) | 27.5% | 28.2% |
| Standard Deviation (Population) | 27.2% | 27.5% |
Similar Demographics by Births to Unmarried Women
Demographics Similar to Cajuns by Births to Unmarried Women
In terms of births to unmarried women, the demographic groups most similar to Cajuns are Sioux (41.0%, a difference of 0.070%), Bahamian (40.8%, a difference of 0.49%), Cape Verdean (41.3%, a difference of 0.87%), Cheyenne (41.3%, a difference of 0.93%), and Immigrants from Cuba (41.5%, a difference of 1.2%).
| Demographics | Rating | Rank | Births to Unmarried Women |
| Dominicans | 0.0 /100 | #315 | Tragic 39.8% |
| Apache | 0.0 /100 | #316 | Tragic 39.9% |
| Immigrants | Dominican Republic | 0.0 /100 | #317 | Tragic 40.1% |
| Immigrants | Bahamas | 0.0 /100 | #318 | Tragic 40.1% |
| Yakama | 0.0 /100 | #319 | Tragic 40.3% |
| Crow | 0.0 /100 | #320 | Tragic 40.4% |
| Bahamians | 0.0 /100 | #321 | Tragic 40.8% |
| Cajuns | 0.0 /100 | #322 | Tragic 41.0% |
| Sioux | 0.0 /100 | #323 | Tragic 41.0% |
| Cape Verdeans | 0.0 /100 | #324 | Tragic 41.3% |
| Cheyenne | 0.0 /100 | #325 | Tragic 41.3% |
| Immigrants | Cuba | 0.0 /100 | #326 | Tragic 41.5% |
| Tsimshian | 0.0 /100 | #327 | Tragic 42.2% |
| Immigrants | Cabo Verde | 0.0 /100 | #328 | Tragic 42.2% |
| Paiute | 0.0 /100 | #329 | Tragic 42.5% |
Demographics Similar to Pima by Births to Unmarried Women
In terms of births to unmarried women, the demographic groups most similar to Pima are Navajo (51.5%, a difference of 0.040%), Menominee (51.1%, a difference of 0.70%), Inupiat (52.1%, a difference of 1.2%), Hopi (50.8%, a difference of 1.3%), and Tohono O'odham (49.8%, a difference of 3.3%).
| Demographics | Rating | Rank | Births to Unmarried Women |
| Blacks/African Americans | 0.0 /100 | #333 | Tragic 44.3% |
| Yuman | 0.0 /100 | #334 | Tragic 44.4% |
| Colville | 0.0 /100 | #335 | Tragic 45.3% |
| Puerto Ricans | 0.0 /100 | #336 | Tragic 45.7% |
| Houma | 0.0 /100 | #337 | Tragic 46.6% |
| Arapaho | 0.0 /100 | #338 | Tragic 47.1% |
| Lumbee | 0.0 /100 | #339 | Tragic 48.2% |
| Tohono O'odham | 0.0 /100 | #340 | Tragic 49.8% |
| Hopi | 0.0 /100 | #341 | Tragic 50.8% |
| Menominee | 0.0 /100 | #342 | Tragic 51.1% |
| Pima | 0.0 /100 | #343 | Tragic 51.5% |
| Navajo | 0.0 /100 | #344 | Tragic 51.5% |
| Inupiat | 0.0 /100 | #345 | Tragic 52.1% |
| Pueblo | 0.0 /100 | #346 | Tragic 53.7% |
| Yup'ik | 0.0 /100 | #347 | Tragic 56.4% |