New Zealander vs Korean Births to Unmarried Women
COMPARE
New Zealander
Korean
Births to Unmarried Women
Births to Unmarried Women Comparison
New Zealanders
Koreans
30.3%
BIRTHS TO UNMARRIED WOMEN
85.5/ 100
METRIC RATING
132nd/ 347
METRIC RANK
30.1%
BIRTHS TO UNMARRIED WOMEN
88.9/ 100
METRIC RATING
121st/ 347
METRIC RANK
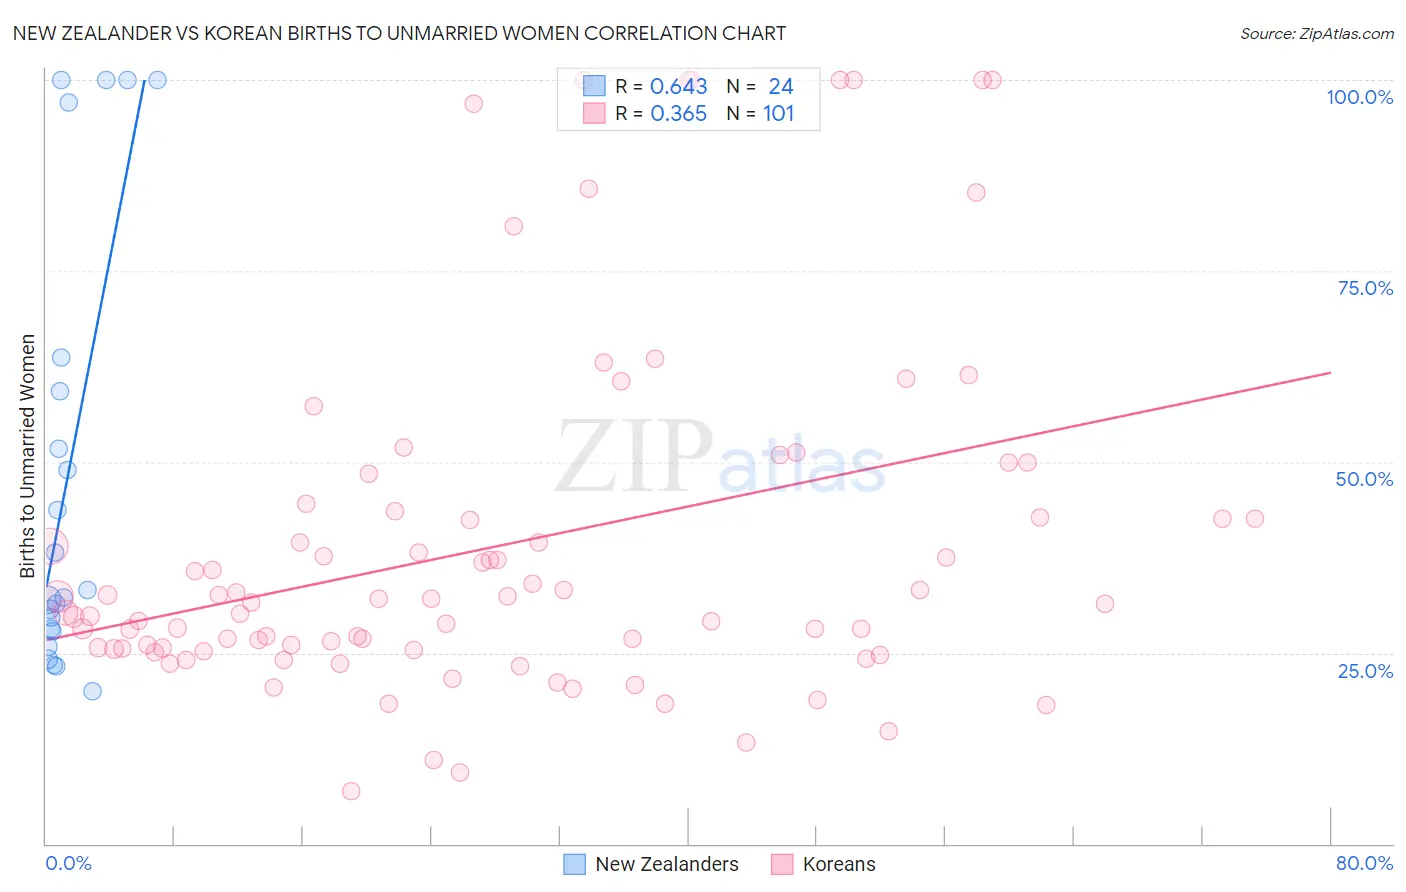
New Zealander vs Korean Births to Unmarried Women Correlation Chart
The statistical analysis conducted on geographies consisting of 103,815,095 people shows a significant positive correlation between the proportion of New Zealanders and percentage of births to unmarried women in the United States with a correlation coefficient (R) of 0.643 and weighted average of 30.3%. Similarly, the statistical analysis conducted on geographies consisting of 466,988,654 people shows a mild positive correlation between the proportion of Koreans and percentage of births to unmarried women in the United States with a correlation coefficient (R) of 0.365 and weighted average of 30.1%, a difference of 0.77%.
Births to Unmarried Women Correlation Summary
| Measurement | New Zealander | Korean |
| Minimum | 20.0% | 6.8% |
| Maximum | 100.0% | 100.0% |
| Range | 80.0% | 93.2% |
| Mean | 48.5% | 39.1% |
| Median | 32.8% | 31.5% |
| Interquartile 25% (IQ1) | 28.0% | 25.5% |
| Interquartile 75% (IQ3) | 61.5% | 43.1% |
| Interquartile Range (IQR) | 33.5% | 17.6% |
| Standard Deviation (Sample) | 28.9% | 22.9% |
| Standard Deviation (Population) | 28.3% | 22.8% |
Demographics Similar to New Zealanders and Koreans by Births to Unmarried Women
In terms of births to unmarried women, the demographic groups most similar to New Zealanders are Immigrants from Zimbabwe (30.3%, a difference of 0.030%), Immigrants from Bosnia and Herzegovina (30.3%, a difference of 0.050%), Immigrants from Morocco (30.4%, a difference of 0.050%), Immigrants from Spain (30.3%, a difference of 0.060%), and Immigrants from South Eastern Asia (30.4%, a difference of 0.060%). Similarly, the demographic groups most similar to Koreans are Immigrants from Argentina (30.1%, a difference of 0.050%), Ugandan (30.1%, a difference of 0.070%), Syrian (30.2%, a difference of 0.18%), Croatian (30.2%, a difference of 0.21%), and Vietnamese (30.2%, a difference of 0.28%).
| Demographics | Rating | Rank | Births to Unmarried Women |
| Immigrants | Italy | 91.7 /100 | #116 | Exceptional 29.9% |
| Immigrants | Netherlands | 91.1 /100 | #117 | Exceptional 29.9% |
| Immigrants | Norway | 91.0 /100 | #118 | Exceptional 29.9% |
| Argentineans | 90.5 /100 | #119 | Exceptional 30.0% |
| Ugandans | 89.2 /100 | #120 | Excellent 30.1% |
| Koreans | 88.9 /100 | #121 | Excellent 30.1% |
| Immigrants | Argentina | 88.7 /100 | #122 | Excellent 30.1% |
| Syrians | 88.2 /100 | #123 | Excellent 30.2% |
| Croatians | 88.0 /100 | #124 | Excellent 30.2% |
| Vietnamese | 87.7 /100 | #125 | Excellent 30.2% |
| Europeans | 87.2 /100 | #126 | Excellent 30.2% |
| Chinese | 87.1 /100 | #127 | Excellent 30.2% |
| Icelanders | 86.0 /100 | #128 | Excellent 30.3% |
| Immigrants | Spain | 85.8 /100 | #129 | Excellent 30.3% |
| Immigrants | Bosnia and Herzegovina | 85.7 /100 | #130 | Excellent 30.3% |
| Immigrants | Zimbabwe | 85.7 /100 | #131 | Excellent 30.3% |
| New Zealanders | 85.5 /100 | #132 | Excellent 30.3% |
| Immigrants | Morocco | 85.2 /100 | #133 | Excellent 30.4% |
| Immigrants | South Eastern Asia | 85.2 /100 | #134 | Excellent 30.4% |
| Brazilians | 84.8 /100 | #135 | Excellent 30.4% |
| Immigrants | Scotland | 84.6 /100 | #136 | Excellent 30.4% |