Guamanian/Chamorro vs Venezuelan Average Family Size
COMPARE
Guamanian/Chamorro
Venezuelan
Average Family Size
Average Family Size Comparison
Guamanians/Chamorros
Venezuelans
3.29
AVERAGE FAMILY SIZE
98.6/ 100
METRIC RATING
100th/ 347
METRIC RANK
3.25
AVERAGE FAMILY SIZE
81.4/ 100
METRIC RATING
141st/ 347
METRIC RANK
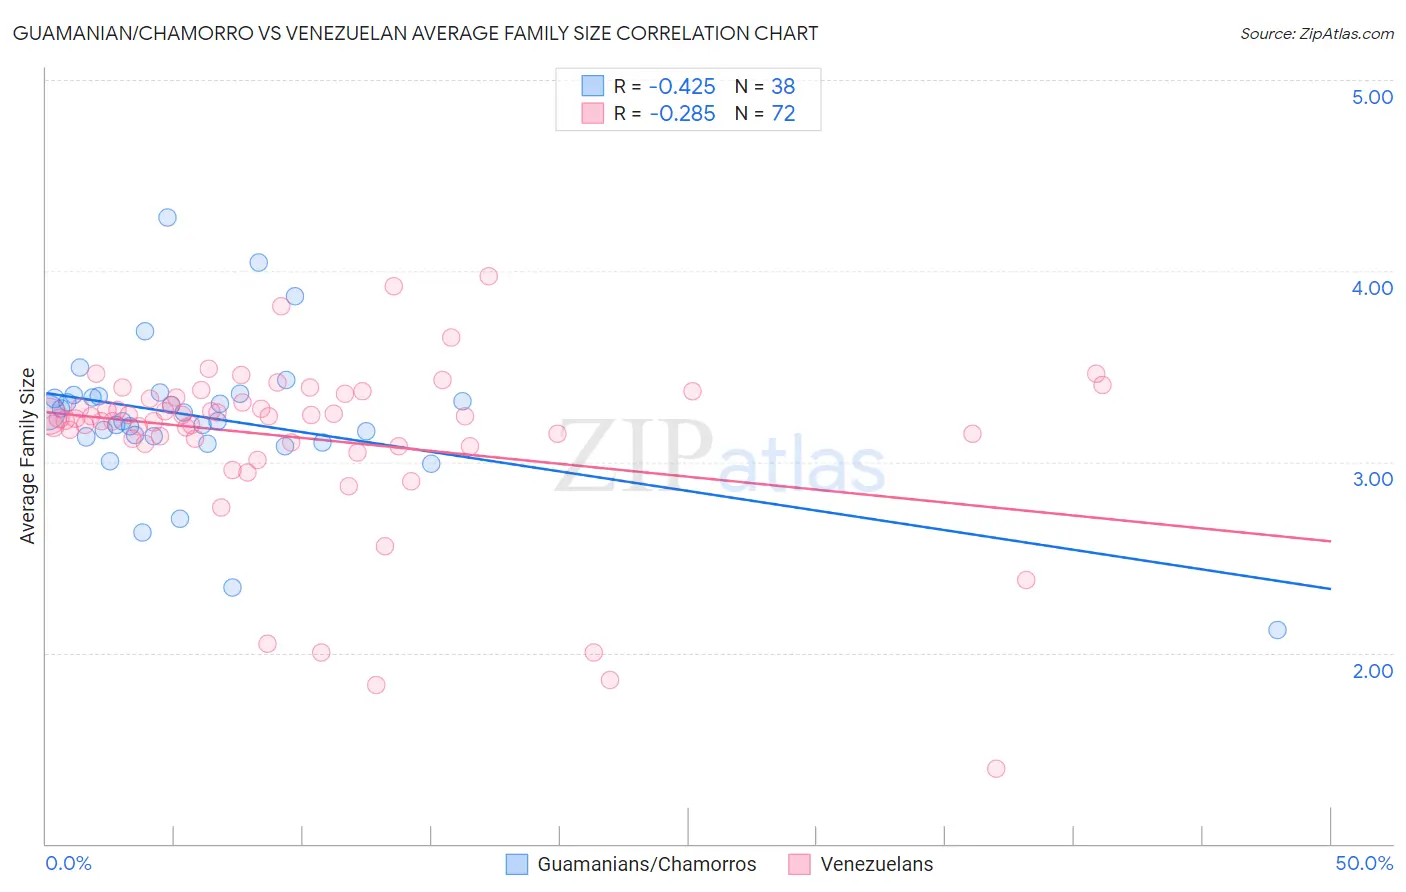
Guamanian/Chamorro vs Venezuelan Average Family Size Correlation Chart
The statistical analysis conducted on geographies consisting of 221,865,945 people shows a moderate negative correlation between the proportion of Guamanians/Chamorros and average family size in the United States with a correlation coefficient (R) of -0.425 and weighted average of 3.29. Similarly, the statistical analysis conducted on geographies consisting of 306,140,333 people shows a weak negative correlation between the proportion of Venezuelans and average family size in the United States with a correlation coefficient (R) of -0.285 and weighted average of 3.25, a difference of 1.3%.
Average Family Size Correlation Summary
| Measurement | Guamanian/Chamorro | Venezuelan |
| Minimum | 2.12 | 1.39 |
| Maximum | 4.28 | 3.97 |
| Range | 2.16 | 2.58 |
| Mean | 3.23 | 3.12 |
| Median | 3.24 | 3.23 |
| Interquartile 25% (IQ1) | 3.13 | 3.10 |
| Interquartile 75% (IQ3) | 3.34 | 3.33 |
| Interquartile Range (IQR) | 0.21 | 0.24 |
| Standard Deviation (Sample) | 0.38 | 0.46 |
| Standard Deviation (Population) | 0.38 | 0.45 |
Similar Demographics by Average Family Size
Demographics Similar to Guamanians/Chamorros by Average Family Size
In terms of average family size, the demographic groups most similar to Guamanians/Chamorros are Immigrants from Oceania (3.29, a difference of 0.010%), Barbadian (3.29, a difference of 0.010%), Nigerian (3.29, a difference of 0.010%), Immigrants from Burma/Myanmar (3.29, a difference of 0.020%), and West Indian (3.29, a difference of 0.020%).
| Demographics | Rating | Rank | Average Family Size |
| Peruvians | 99.2 /100 | #93 | Exceptional 3.30 |
| Sierra Leoneans | 99.0 /100 | #94 | Exceptional 3.30 |
| Immigrants | Lebanon | 99.0 /100 | #95 | Exceptional 3.30 |
| U.S. Virgin Islanders | 98.8 /100 | #96 | Exceptional 3.29 |
| Immigrants | Oceania | 98.7 /100 | #97 | Exceptional 3.29 |
| Barbadians | 98.6 /100 | #98 | Exceptional 3.29 |
| Nigerians | 98.6 /100 | #99 | Exceptional 3.29 |
| Guamanians/Chamorros | 98.6 /100 | #100 | Exceptional 3.29 |
| Immigrants | Burma/Myanmar | 98.6 /100 | #101 | Exceptional 3.29 |
| West Indians | 98.5 /100 | #102 | Exceptional 3.29 |
| Immigrants | Western Africa | 98.4 /100 | #103 | Exceptional 3.29 |
| Bolivians | 98.3 /100 | #104 | Exceptional 3.29 |
| Immigrants | Ghana | 98.1 /100 | #105 | Exceptional 3.29 |
| Paiute | 98.0 /100 | #106 | Exceptional 3.29 |
| Ghanaians | 98.0 /100 | #107 | Exceptional 3.29 |
Demographics Similar to Venezuelans by Average Family Size
In terms of average family size, the demographic groups most similar to Venezuelans are Subsaharan African (3.25, a difference of 0.0%), Cuban (3.25, a difference of 0.010%), Immigrants from Ethiopia (3.25, a difference of 0.010%), Liberian (3.25, a difference of 0.010%), and Bhutanese (3.25, a difference of 0.010%).
| Demographics | Rating | Rank | Average Family Size |
| Africans | 84.9 /100 | #134 | Excellent 3.25 |
| Panamanians | 84.2 /100 | #135 | Excellent 3.25 |
| Comanche | 82.8 /100 | #136 | Excellent 3.25 |
| Immigrants | Middle Africa | 82.4 /100 | #137 | Excellent 3.25 |
| Cubans | 81.8 /100 | #138 | Excellent 3.25 |
| Immigrants | Ethiopia | 81.6 /100 | #139 | Excellent 3.25 |
| Sub-Saharan Africans | 81.6 /100 | #140 | Excellent 3.25 |
| Venezuelans | 81.4 /100 | #141 | Excellent 3.25 |
| Liberians | 81.2 /100 | #142 | Excellent 3.25 |
| Bhutanese | 81.0 /100 | #143 | Excellent 3.25 |
| Tsimshian | 80.2 /100 | #144 | Excellent 3.25 |
| Armenians | 78.2 /100 | #145 | Good 3.25 |
| Immigrants | Africa | 77.9 /100 | #146 | Good 3.25 |
| Immigrants | Jordan | 75.7 /100 | #147 | Good 3.24 |
| Blackfeet | 75.0 /100 | #148 | Good 3.24 |