Sudanese vs Venezuelan Average Family Size
COMPARE
Sudanese
Venezuelan
Average Family Size
Average Family Size Comparison
Sudanese
Venezuelans
3.20
AVERAGE FAMILY SIZE
13.3/ 100
METRIC RATING
209th/ 347
METRIC RANK
3.25
AVERAGE FAMILY SIZE
81.4/ 100
METRIC RATING
141st/ 347
METRIC RANK
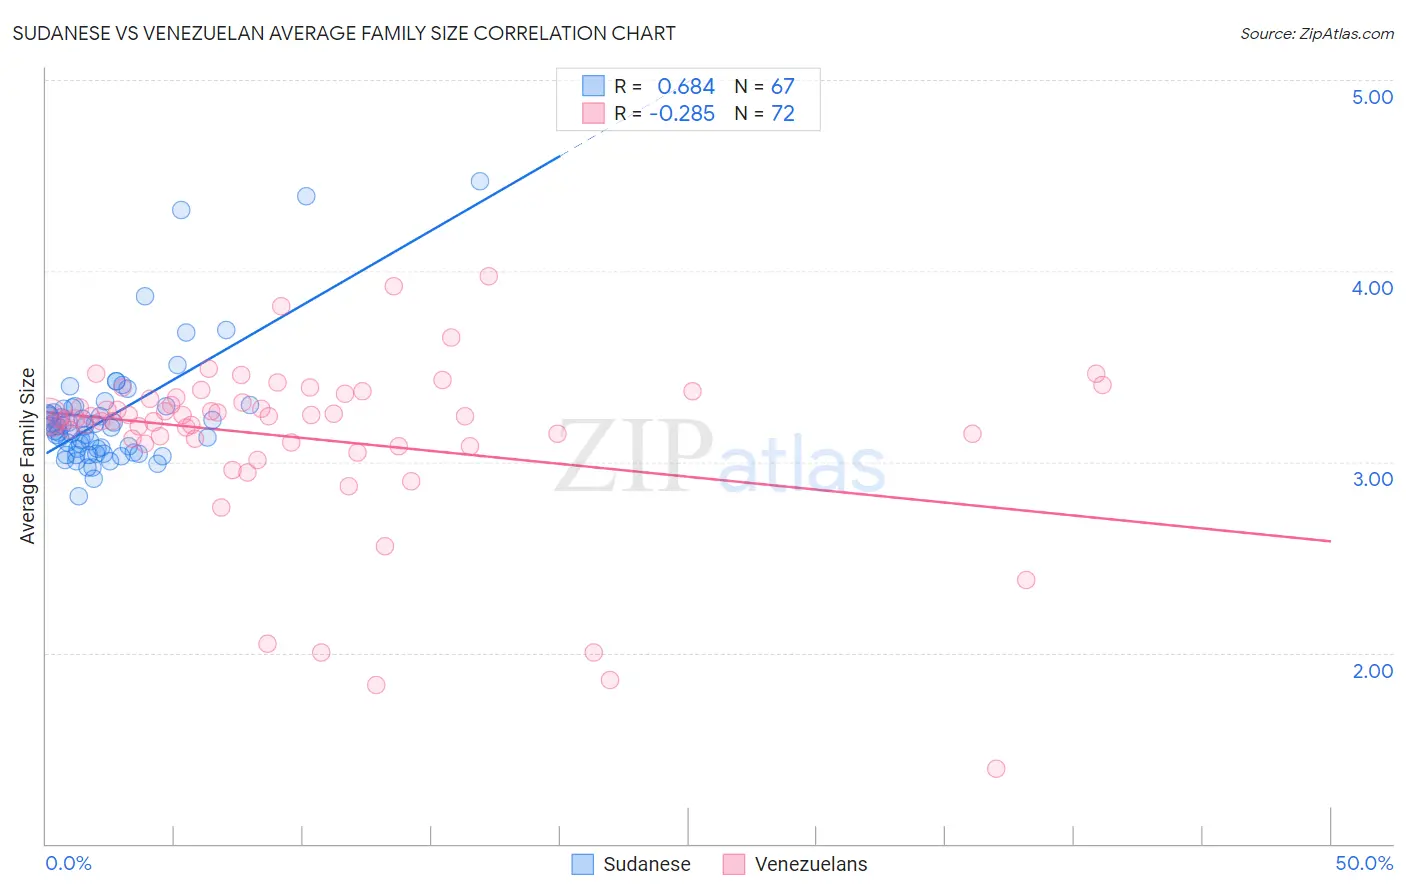
Sudanese vs Venezuelan Average Family Size Correlation Chart
The statistical analysis conducted on geographies consisting of 110,078,191 people shows a significant positive correlation between the proportion of Sudanese and average family size in the United States with a correlation coefficient (R) of 0.684 and weighted average of 3.20. Similarly, the statistical analysis conducted on geographies consisting of 306,140,333 people shows a weak negative correlation between the proportion of Venezuelans and average family size in the United States with a correlation coefficient (R) of -0.285 and weighted average of 3.25, a difference of 1.5%.
Average Family Size Correlation Summary
| Measurement | Sudanese | Venezuelan |
| Minimum | 2.82 | 1.39 |
| Maximum | 4.47 | 3.97 |
| Range | 1.65 | 2.58 |
| Mean | 3.24 | 3.12 |
| Median | 3.18 | 3.23 |
| Interquartile 25% (IQ1) | 3.05 | 3.10 |
| Interquartile 75% (IQ3) | 3.28 | 3.33 |
| Interquartile Range (IQR) | 0.23 | 0.24 |
| Standard Deviation (Sample) | 0.31 | 0.46 |
| Standard Deviation (Population) | 0.31 | 0.45 |
Similar Demographics by Average Family Size
Demographics Similar to Sudanese by Average Family Size
In terms of average family size, the demographic groups most similar to Sudanese are Chippewa (3.20, a difference of 0.0%), Filipino (3.20, a difference of 0.010%), Zimbabwean (3.20, a difference of 0.030%), Immigrants from Iran (3.20, a difference of 0.050%), and Creek (3.20, a difference of 0.050%).
| Demographics | Rating | Rank | Average Family Size |
| Immigrants | India | 18.5 /100 | #202 | Poor 3.21 |
| Immigrants | Nepal | 18.1 /100 | #203 | Poor 3.21 |
| Immigrants | Poland | 16.6 /100 | #204 | Poor 3.20 |
| Paraguayans | 16.3 /100 | #205 | Poor 3.20 |
| Immigrants | Cabo Verde | 16.0 /100 | #206 | Poor 3.20 |
| Filipinos | 13.6 /100 | #207 | Poor 3.20 |
| Chippewa | 13.3 /100 | #208 | Poor 3.20 |
| Sudanese | 13.3 /100 | #209 | Poor 3.20 |
| Zimbabweans | 12.6 /100 | #210 | Poor 3.20 |
| Immigrants | Iran | 12.1 /100 | #211 | Poor 3.20 |
| Creek | 12.1 /100 | #212 | Poor 3.20 |
| Mongolians | 11.5 /100 | #213 | Poor 3.20 |
| Somalis | 11.2 /100 | #214 | Poor 3.20 |
| Delaware | 11.1 /100 | #215 | Poor 3.20 |
| Bermudans | 11.0 /100 | #216 | Poor 3.20 |
Demographics Similar to Venezuelans by Average Family Size
In terms of average family size, the demographic groups most similar to Venezuelans are Subsaharan African (3.25, a difference of 0.0%), Cuban (3.25, a difference of 0.010%), Immigrants from Ethiopia (3.25, a difference of 0.010%), Liberian (3.25, a difference of 0.010%), and Bhutanese (3.25, a difference of 0.010%).
| Demographics | Rating | Rank | Average Family Size |
| Africans | 84.9 /100 | #134 | Excellent 3.25 |
| Panamanians | 84.2 /100 | #135 | Excellent 3.25 |
| Comanche | 82.8 /100 | #136 | Excellent 3.25 |
| Immigrants | Middle Africa | 82.4 /100 | #137 | Excellent 3.25 |
| Cubans | 81.8 /100 | #138 | Excellent 3.25 |
| Immigrants | Ethiopia | 81.6 /100 | #139 | Excellent 3.25 |
| Sub-Saharan Africans | 81.6 /100 | #140 | Excellent 3.25 |
| Venezuelans | 81.4 /100 | #141 | Excellent 3.25 |
| Liberians | 81.2 /100 | #142 | Excellent 3.25 |
| Bhutanese | 81.0 /100 | #143 | Excellent 3.25 |
| Tsimshian | 80.2 /100 | #144 | Excellent 3.25 |
| Armenians | 78.2 /100 | #145 | Good 3.25 |
| Immigrants | Africa | 77.9 /100 | #146 | Good 3.25 |
| Immigrants | Jordan | 75.7 /100 | #147 | Good 3.24 |
| Blackfeet | 75.0 /100 | #148 | Good 3.24 |