Ottawa vs Venezuelan Average Family Size
COMPARE
Ottawa
Venezuelan
Average Family Size
Average Family Size Comparison
Ottawa
Venezuelans
3.11
AVERAGE FAMILY SIZE
0.0/ 100
METRIC RATING
326th/ 347
METRIC RANK
3.25
AVERAGE FAMILY SIZE
81.4/ 100
METRIC RATING
141st/ 347
METRIC RANK
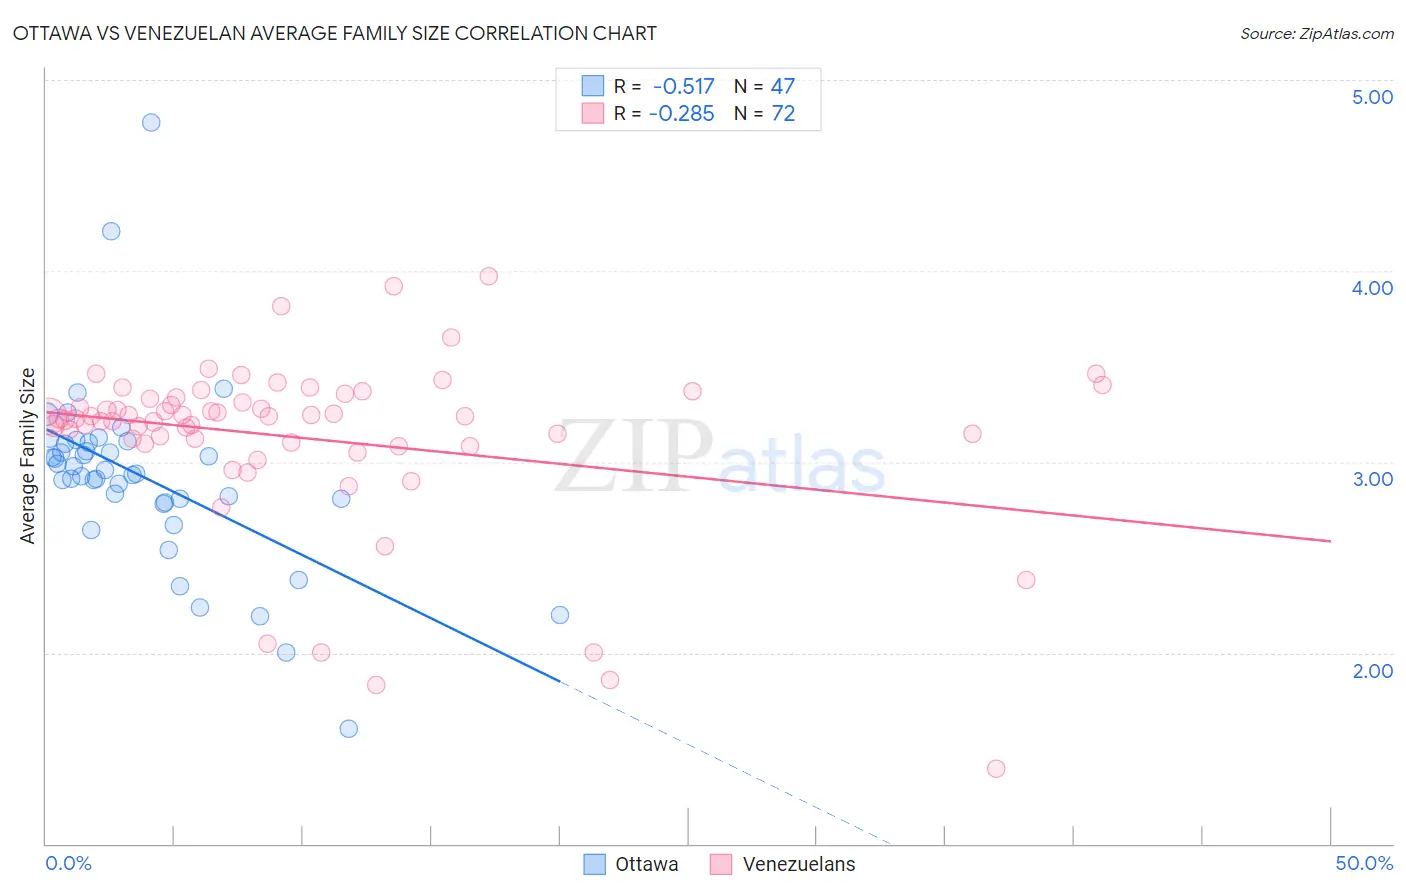
Ottawa vs Venezuelan Average Family Size Correlation Chart
The statistical analysis conducted on geographies consisting of 49,944,420 people shows a substantial negative correlation between the proportion of Ottawa and average family size in the United States with a correlation coefficient (R) of -0.517 and weighted average of 3.11. Similarly, the statistical analysis conducted on geographies consisting of 306,140,333 people shows a weak negative correlation between the proportion of Venezuelans and average family size in the United States with a correlation coefficient (R) of -0.285 and weighted average of 3.25, a difference of 4.5%.
Average Family Size Correlation Summary
| Measurement | Ottawa | Venezuelan |
| Minimum | 1.60 | 1.39 |
| Maximum | 4.78 | 3.97 |
| Range | 3.18 | 2.58 |
| Mean | 2.92 | 3.12 |
| Median | 2.94 | 3.23 |
| Interquartile 25% (IQ1) | 2.79 | 3.10 |
| Interquartile 75% (IQ3) | 3.10 | 3.33 |
| Interquartile Range (IQR) | 0.31 | 0.24 |
| Standard Deviation (Sample) | 0.49 | 0.46 |
| Standard Deviation (Population) | 0.49 | 0.45 |
Similar Demographics by Average Family Size
Demographics Similar to Ottawa by Average Family Size
In terms of average family size, the demographic groups most similar to Ottawa are Dutch (3.11, a difference of 0.010%), Czech (3.11, a difference of 0.010%), English (3.11, a difference of 0.050%), Belgian (3.11, a difference of 0.070%), and Celtic (3.11, a difference of 0.090%).
| Demographics | Rating | Rank | Average Family Size |
| Welsh | 0.1 /100 | #319 | Tragic 3.12 |
| Immigrants | North America | 0.0 /100 | #320 | Tragic 3.12 |
| Immigrants | Austria | 0.0 /100 | #321 | Tragic 3.12 |
| Immigrants | Canada | 0.0 /100 | #322 | Tragic 3.12 |
| Soviet Union | 0.0 /100 | #323 | Tragic 3.11 |
| Celtics | 0.0 /100 | #324 | Tragic 3.11 |
| English | 0.0 /100 | #325 | Tragic 3.11 |
| Ottawa | 0.0 /100 | #326 | Tragic 3.11 |
| Dutch | 0.0 /100 | #327 | Tragic 3.11 |
| Czechs | 0.0 /100 | #328 | Tragic 3.11 |
| Belgians | 0.0 /100 | #329 | Tragic 3.11 |
| Latvians | 0.0 /100 | #330 | Tragic 3.11 |
| Scotch-Irish | 0.0 /100 | #331 | Tragic 3.11 |
| Scottish | 0.0 /100 | #332 | Tragic 3.11 |
| Estonians | 0.0 /100 | #333 | Tragic 3.10 |
Demographics Similar to Venezuelans by Average Family Size
In terms of average family size, the demographic groups most similar to Venezuelans are Subsaharan African (3.25, a difference of 0.0%), Cuban (3.25, a difference of 0.010%), Immigrants from Ethiopia (3.25, a difference of 0.010%), Liberian (3.25, a difference of 0.010%), and Bhutanese (3.25, a difference of 0.010%).
| Demographics | Rating | Rank | Average Family Size |
| Africans | 84.9 /100 | #134 | Excellent 3.25 |
| Panamanians | 84.2 /100 | #135 | Excellent 3.25 |
| Comanche | 82.8 /100 | #136 | Excellent 3.25 |
| Immigrants | Middle Africa | 82.4 /100 | #137 | Excellent 3.25 |
| Cubans | 81.8 /100 | #138 | Excellent 3.25 |
| Immigrants | Ethiopia | 81.6 /100 | #139 | Excellent 3.25 |
| Sub-Saharan Africans | 81.6 /100 | #140 | Excellent 3.25 |
| Venezuelans | 81.4 /100 | #141 | Excellent 3.25 |
| Liberians | 81.2 /100 | #142 | Excellent 3.25 |
| Bhutanese | 81.0 /100 | #143 | Excellent 3.25 |
| Tsimshian | 80.2 /100 | #144 | Excellent 3.25 |
| Armenians | 78.2 /100 | #145 | Good 3.25 |
| Immigrants | Africa | 77.9 /100 | #146 | Good 3.25 |
| Immigrants | Jordan | 75.7 /100 | #147 | Good 3.24 |
| Blackfeet | 75.0 /100 | #148 | Good 3.24 |