Ute vs Osage Single Mother Households
COMPARE
Ute
Osage
Single Mother Households
Single Mother Households Comparison
Ute
Osage
7.1%
SINGLE MOTHER HOUSEHOLDS
1.0/ 100
METRIC RATING
236th/ 347
METRIC RANK
6.4%
SINGLE MOTHER HOUSEHOLDS
43.0/ 100
METRIC RATING
177th/ 347
METRIC RANK
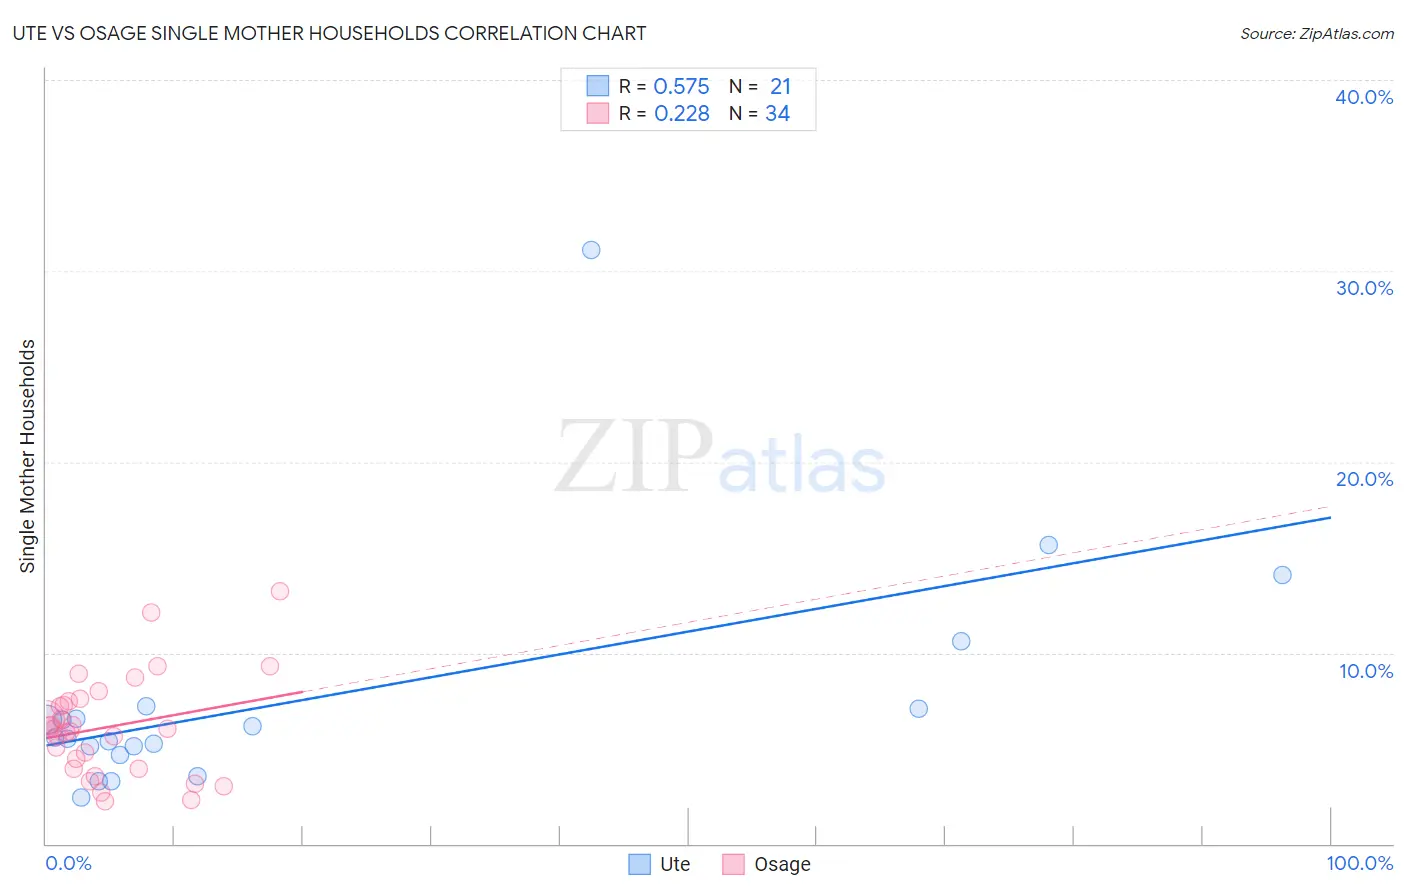
Ute vs Osage Single Mother Households Correlation Chart
The statistical analysis conducted on geographies consisting of 55,640,483 people shows a substantial positive correlation between the proportion of Ute and percentage of single mother households in the United States with a correlation coefficient (R) of 0.575 and weighted average of 7.1%. Similarly, the statistical analysis conducted on geographies consisting of 91,762,553 people shows a weak positive correlation between the proportion of Osage and percentage of single mother households in the United States with a correlation coefficient (R) of 0.228 and weighted average of 6.4%, a difference of 11.7%.
Single Mother Households Correlation Summary
| Measurement | Ute | Osage |
| Minimum | 2.4% | 2.2% |
| Maximum | 31.1% | 13.2% |
| Range | 28.6% | 11.0% |
| Mean | 7.6% | 6.1% |
| Median | 5.6% | 6.0% |
| Interquartile 25% (IQ1) | 4.9% | 4.0% |
| Interquartile 75% (IQ3) | 7.1% | 7.5% |
| Interquartile Range (IQR) | 2.3% | 3.5% |
| Standard Deviation (Sample) | 6.3% | 2.6% |
| Standard Deviation (Population) | 6.1% | 2.6% |
Similar Demographics by Single Mother Households
Demographics Similar to Ute by Single Mother Households
In terms of single mother households, the demographic groups most similar to Ute are Arapaho (7.1%, a difference of 0.090%), Panamanian (7.1%, a difference of 0.23%), Kiowa (7.1%, a difference of 0.50%), Immigrants from Burma/Myanmar (7.0%, a difference of 0.79%), and Immigrants from Panama (7.2%, a difference of 0.82%).
| Demographics | Rating | Rank | Single Mother Households |
| Immigrants | Kenya | 2.1 /100 | #229 | Tragic 7.0% |
| Creek | 1.6 /100 | #230 | Tragic 7.0% |
| Spanish Americans | 1.6 /100 | #231 | Tragic 7.0% |
| Comanche | 1.5 /100 | #232 | Tragic 7.0% |
| Choctaw | 1.4 /100 | #233 | Tragic 7.0% |
| Chickasaw | 1.4 /100 | #234 | Tragic 7.0% |
| Immigrants | Burma/Myanmar | 1.4 /100 | #235 | Tragic 7.0% |
| Ute | 1.0 /100 | #236 | Tragic 7.1% |
| Arapaho | 1.0 /100 | #237 | Tragic 7.1% |
| Panamanians | 0.9 /100 | #238 | Tragic 7.1% |
| Kiowa | 0.8 /100 | #239 | Tragic 7.1% |
| Immigrants | Panama | 0.7 /100 | #240 | Tragic 7.2% |
| Immigrants | Portugal | 0.6 /100 | #241 | Tragic 7.2% |
| Fijians | 0.6 /100 | #242 | Tragic 7.2% |
| Ecuadorians | 0.6 /100 | #243 | Tragic 7.2% |
Demographics Similar to Osage by Single Mother Households
In terms of single mother households, the demographic groups most similar to Osage are Immigrants from Bosnia and Herzegovina (6.3%, a difference of 0.14%), Marshallese (6.3%, a difference of 0.30%), Portuguese (6.4%, a difference of 0.34%), Hmong (6.4%, a difference of 0.36%), and Immigrants from Morocco (6.3%, a difference of 0.77%).
| Demographics | Rating | Rank | Single Mother Households |
| Immigrants | Oceania | 54.6 /100 | #170 | Average 6.3% |
| Afghans | 52.5 /100 | #171 | Average 6.3% |
| Immigrants | South Eastern Asia | 52.2 /100 | #172 | Average 6.3% |
| Immigrants | Vietnam | 51.5 /100 | #173 | Average 6.3% |
| Immigrants | Morocco | 50.0 /100 | #174 | Average 6.3% |
| Marshallese | 45.8 /100 | #175 | Average 6.3% |
| Immigrants | Bosnia and Herzegovina | 44.3 /100 | #176 | Average 6.3% |
| Osage | 43.0 /100 | #177 | Average 6.4% |
| Portuguese | 40.0 /100 | #178 | Fair 6.4% |
| Hmong | 39.8 /100 | #179 | Fair 6.4% |
| Immigrants | Nepal | 36.1 /100 | #180 | Fair 6.4% |
| Spanish | 33.4 /100 | #181 | Fair 6.4% |
| South American Indians | 33.4 /100 | #182 | Fair 6.4% |
| Spaniards | 27.8 /100 | #183 | Fair 6.5% |
| Ethiopians | 26.0 /100 | #184 | Fair 6.5% |