Egyptian vs Osage Single Mother Households
COMPARE
Egyptian
Osage
Single Mother Households
Single Mother Households Comparison
Egyptians
Osage
5.9%
SINGLE MOTHER HOUSEHOLDS
90.7/ 100
METRIC RATING
133rd/ 347
METRIC RANK
6.4%
SINGLE MOTHER HOUSEHOLDS
43.0/ 100
METRIC RATING
177th/ 347
METRIC RANK
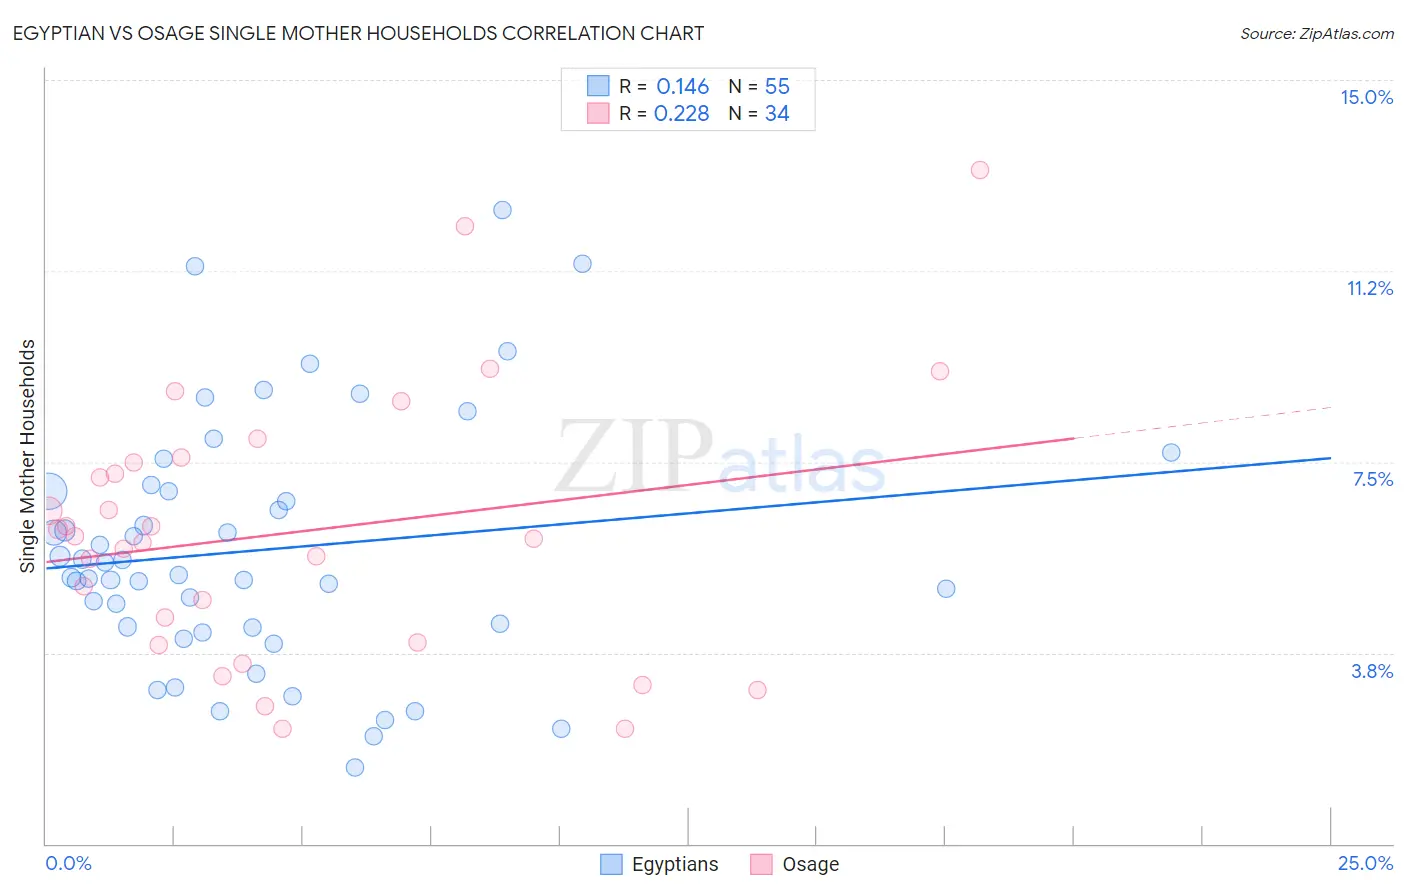
Egyptian vs Osage Single Mother Households Correlation Chart
The statistical analysis conducted on geographies consisting of 276,342,561 people shows a poor positive correlation between the proportion of Egyptians and percentage of single mother households in the United States with a correlation coefficient (R) of 0.146 and weighted average of 5.9%. Similarly, the statistical analysis conducted on geographies consisting of 91,762,553 people shows a weak positive correlation between the proportion of Osage and percentage of single mother households in the United States with a correlation coefficient (R) of 0.228 and weighted average of 6.4%, a difference of 7.4%.
Single Mother Households Correlation Summary
| Measurement | Egyptian | Osage |
| Minimum | 1.5% | 2.2% |
| Maximum | 12.4% | 13.2% |
| Range | 11.0% | 11.0% |
| Mean | 5.8% | 6.1% |
| Median | 5.3% | 6.0% |
| Interquartile 25% (IQ1) | 4.2% | 4.0% |
| Interquartile 75% (IQ3) | 6.9% | 7.5% |
| Interquartile Range (IQR) | 2.7% | 3.5% |
| Standard Deviation (Sample) | 2.4% | 2.6% |
| Standard Deviation (Population) | 2.4% | 2.6% |
Similar Demographics by Single Mother Households
Demographics Similar to Egyptians by Single Mother Households
In terms of single mother households, the demographic groups most similar to Egyptians are Canadian (5.9%, a difference of 0.060%), Albanian (5.9%, a difference of 0.15%), Immigrants from Saudi Arabia (5.9%, a difference of 0.15%), Immigrants from Spain (5.9%, a difference of 0.20%), and Palestinian (5.9%, a difference of 0.55%).
| Demographics | Rating | Rank | Single Mother Households |
| Welsh | 92.8 /100 | #126 | Exceptional 5.9% |
| Lebanese | 92.4 /100 | #127 | Exceptional 5.9% |
| Czechoslovakians | 92.2 /100 | #128 | Exceptional 5.9% |
| Immigrants | Bolivia | 92.2 /100 | #129 | Exceptional 5.9% |
| Palestinians | 92.1 /100 | #130 | Exceptional 5.9% |
| Immigrants | Spain | 91.2 /100 | #131 | Exceptional 5.9% |
| Albanians | 91.1 /100 | #132 | Exceptional 5.9% |
| Egyptians | 90.7 /100 | #133 | Exceptional 5.9% |
| Canadians | 90.5 /100 | #134 | Exceptional 5.9% |
| Immigrants | Saudi Arabia | 90.2 /100 | #135 | Exceptional 5.9% |
| Jordanians | 88.9 /100 | #136 | Excellent 6.0% |
| Immigrants | Pakistan | 88.4 /100 | #137 | Excellent 6.0% |
| Icelanders | 86.9 /100 | #138 | Excellent 6.0% |
| Syrians | 86.0 /100 | #139 | Excellent 6.0% |
| French | 85.7 /100 | #140 | Excellent 6.0% |
Demographics Similar to Osage by Single Mother Households
In terms of single mother households, the demographic groups most similar to Osage are Immigrants from Bosnia and Herzegovina (6.3%, a difference of 0.14%), Marshallese (6.3%, a difference of 0.30%), Portuguese (6.4%, a difference of 0.34%), Hmong (6.4%, a difference of 0.36%), and Immigrants from Morocco (6.3%, a difference of 0.77%).
| Demographics | Rating | Rank | Single Mother Households |
| Immigrants | Oceania | 54.6 /100 | #170 | Average 6.3% |
| Afghans | 52.5 /100 | #171 | Average 6.3% |
| Immigrants | South Eastern Asia | 52.2 /100 | #172 | Average 6.3% |
| Immigrants | Vietnam | 51.5 /100 | #173 | Average 6.3% |
| Immigrants | Morocco | 50.0 /100 | #174 | Average 6.3% |
| Marshallese | 45.8 /100 | #175 | Average 6.3% |
| Immigrants | Bosnia and Herzegovina | 44.3 /100 | #176 | Average 6.3% |
| Osage | 43.0 /100 | #177 | Average 6.4% |
| Portuguese | 40.0 /100 | #178 | Fair 6.4% |
| Hmong | 39.8 /100 | #179 | Fair 6.4% |
| Immigrants | Nepal | 36.1 /100 | #180 | Fair 6.4% |
| Spanish | 33.4 /100 | #181 | Fair 6.4% |
| South American Indians | 33.4 /100 | #182 | Fair 6.4% |
| Spaniards | 27.8 /100 | #183 | Fair 6.5% |
| Ethiopians | 26.0 /100 | #184 | Fair 6.5% |