Argentinean vs Osage Single Mother Households
COMPARE
Argentinean
Osage
Single Mother Households
Single Mother Households Comparison
Argentineans
Osage
5.8%
SINGLE MOTHER HOUSEHOLDS
93.7/ 100
METRIC RATING
121st/ 347
METRIC RANK
6.4%
SINGLE MOTHER HOUSEHOLDS
43.0/ 100
METRIC RATING
177th/ 347
METRIC RANK
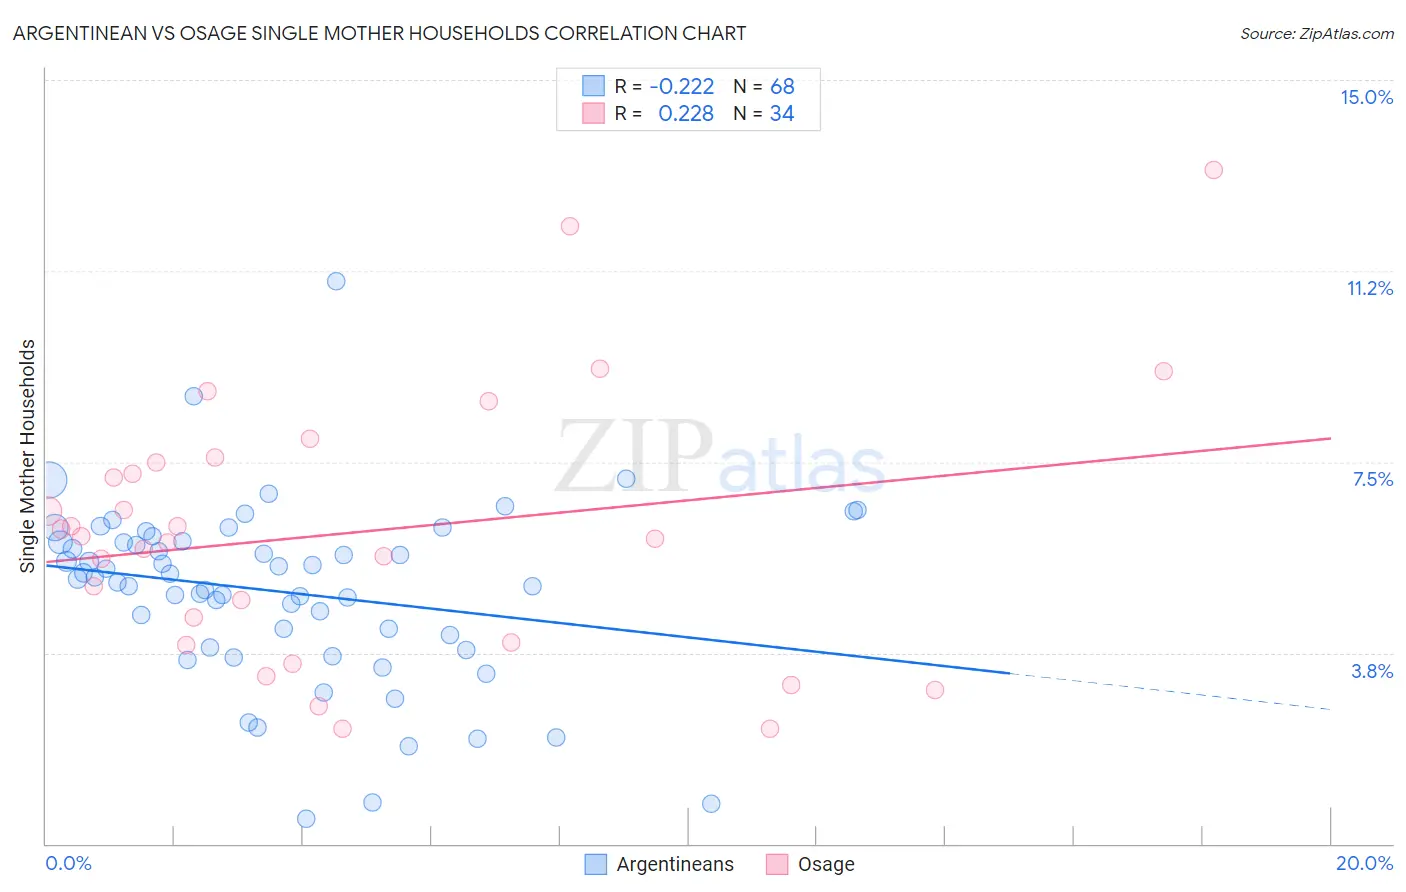
Argentinean vs Osage Single Mother Households Correlation Chart
The statistical analysis conducted on geographies consisting of 296,614,684 people shows a weak negative correlation between the proportion of Argentineans and percentage of single mother households in the United States with a correlation coefficient (R) of -0.222 and weighted average of 5.8%. Similarly, the statistical analysis conducted on geographies consisting of 91,762,553 people shows a weak positive correlation between the proportion of Osage and percentage of single mother households in the United States with a correlation coefficient (R) of 0.228 and weighted average of 6.4%, a difference of 8.8%.
Single Mother Households Correlation Summary
| Measurement | Argentinean | Osage |
| Minimum | 0.49% | 2.2% |
| Maximum | 11.1% | 13.2% |
| Range | 10.6% | 11.0% |
| Mean | 5.0% | 6.1% |
| Median | 5.2% | 6.0% |
| Interquartile 25% (IQ1) | 4.0% | 4.0% |
| Interquartile 75% (IQ3) | 5.9% | 7.5% |
| Interquartile Range (IQR) | 1.9% | 3.5% |
| Standard Deviation (Sample) | 1.8% | 2.6% |
| Standard Deviation (Population) | 1.8% | 2.6% |
Similar Demographics by Single Mother Households
Demographics Similar to Argentineans by Single Mother Households
In terms of single mother households, the demographic groups most similar to Argentineans are Tongan (5.8%, a difference of 0.020%), Belgian (5.8%, a difference of 0.080%), Immigrants from Uzbekistan (5.9%, a difference of 0.14%), Immigrants from Argentina (5.9%, a difference of 0.21%), and South African (5.8%, a difference of 0.22%).
| Demographics | Rating | Rank | Single Mother Households |
| Dutch | 95.1 /100 | #114 | Exceptional 5.8% |
| Irish | 94.8 /100 | #115 | Exceptional 5.8% |
| Pennsylvania Germans | 94.7 /100 | #116 | Exceptional 5.8% |
| Bolivians | 94.6 /100 | #117 | Exceptional 5.8% |
| Laotians | 94.3 /100 | #118 | Exceptional 5.8% |
| South Africans | 94.1 /100 | #119 | Exceptional 5.8% |
| Tongans | 93.7 /100 | #120 | Exceptional 5.8% |
| Argentineans | 93.7 /100 | #121 | Exceptional 5.8% |
| Belgians | 93.5 /100 | #122 | Exceptional 5.8% |
| Immigrants | Uzbekistan | 93.4 /100 | #123 | Exceptional 5.9% |
| Immigrants | Argentina | 93.2 /100 | #124 | Exceptional 5.9% |
| Slavs | 92.9 /100 | #125 | Exceptional 5.9% |
| Welsh | 92.8 /100 | #126 | Exceptional 5.9% |
| Lebanese | 92.4 /100 | #127 | Exceptional 5.9% |
| Czechoslovakians | 92.2 /100 | #128 | Exceptional 5.9% |
Demographics Similar to Osage by Single Mother Households
In terms of single mother households, the demographic groups most similar to Osage are Immigrants from Bosnia and Herzegovina (6.3%, a difference of 0.14%), Marshallese (6.3%, a difference of 0.30%), Portuguese (6.4%, a difference of 0.34%), Hmong (6.4%, a difference of 0.36%), and Immigrants from Morocco (6.3%, a difference of 0.77%).
| Demographics | Rating | Rank | Single Mother Households |
| Immigrants | Oceania | 54.6 /100 | #170 | Average 6.3% |
| Afghans | 52.5 /100 | #171 | Average 6.3% |
| Immigrants | South Eastern Asia | 52.2 /100 | #172 | Average 6.3% |
| Immigrants | Vietnam | 51.5 /100 | #173 | Average 6.3% |
| Immigrants | Morocco | 50.0 /100 | #174 | Average 6.3% |
| Marshallese | 45.8 /100 | #175 | Average 6.3% |
| Immigrants | Bosnia and Herzegovina | 44.3 /100 | #176 | Average 6.3% |
| Osage | 43.0 /100 | #177 | Average 6.4% |
| Portuguese | 40.0 /100 | #178 | Fair 6.4% |
| Hmong | 39.8 /100 | #179 | Fair 6.4% |
| Immigrants | Nepal | 36.1 /100 | #180 | Fair 6.4% |
| Spanish | 33.4 /100 | #181 | Fair 6.4% |
| South American Indians | 33.4 /100 | #182 | Fair 6.4% |
| Spaniards | 27.8 /100 | #183 | Fair 6.5% |
| Ethiopians | 26.0 /100 | #184 | Fair 6.5% |