Navajo vs Immigrants from Honduras 10th Grade
COMPARE
Navajo
Immigrants from Honduras
10th Grade
10th Grade Comparison
Navajo
Immigrants from Honduras
92.3%
10TH GRADE
0.1/ 100
METRIC RATING
277th/ 347
METRIC RANK
88.5%
10TH GRADE
0.0/ 100
METRIC RATING
336th/ 347
METRIC RANK
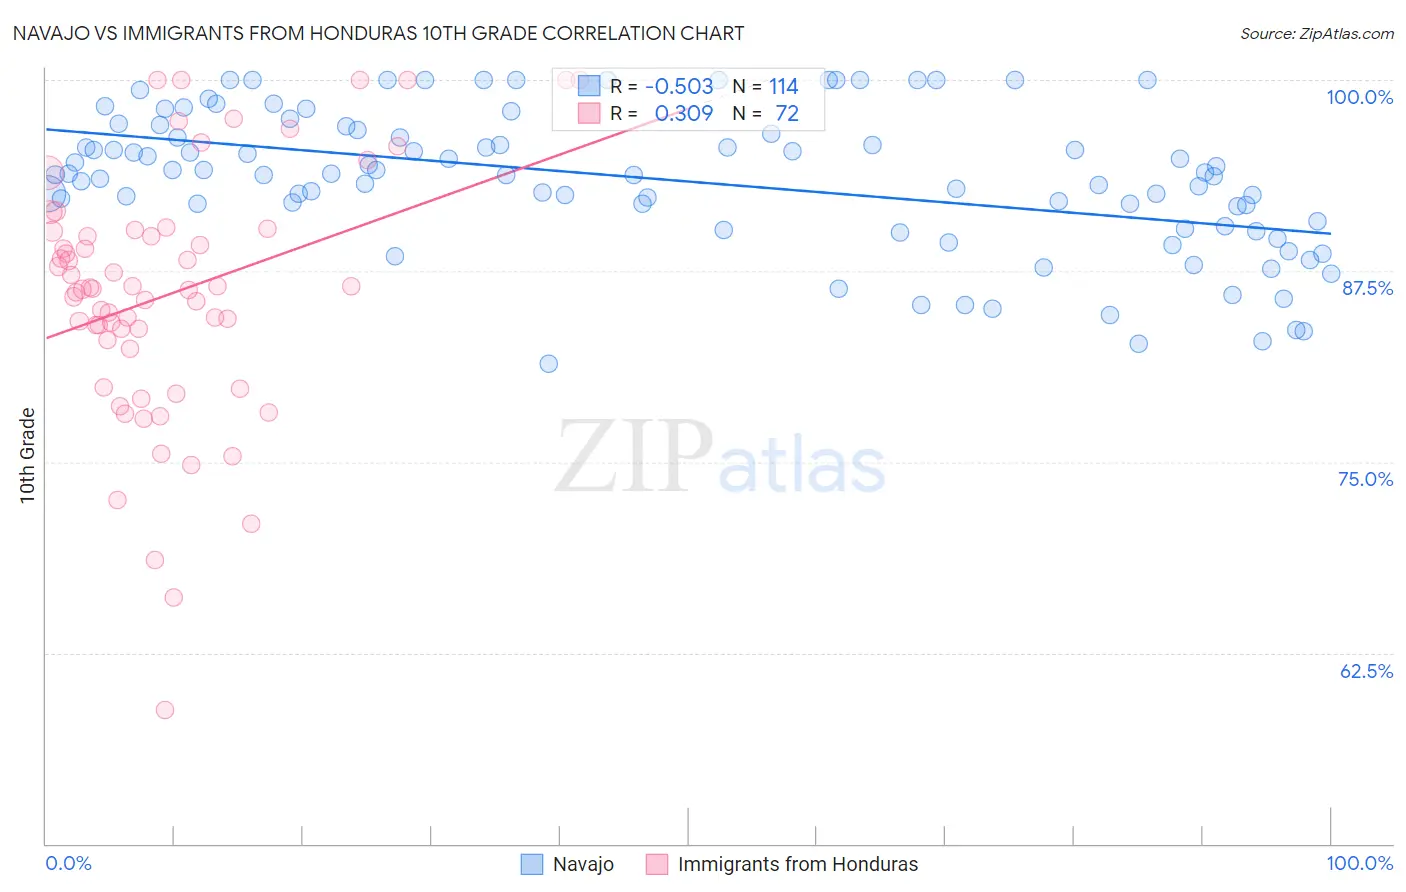
Navajo vs Immigrants from Honduras 10th Grade Correlation Chart
The statistical analysis conducted on geographies consisting of 224,872,587 people shows a substantial negative correlation between the proportion of Navajo and percentage of population with at least 10th grade education in the United States with a correlation coefficient (R) of -0.503 and weighted average of 92.3%. Similarly, the statistical analysis conducted on geographies consisting of 322,637,445 people shows a mild positive correlation between the proportion of Immigrants from Honduras and percentage of population with at least 10th grade education in the United States with a correlation coefficient (R) of 0.309 and weighted average of 88.5%, a difference of 4.2%.
10th Grade Correlation Summary
| Measurement | Navajo | Immigrants from Honduras |
| Minimum | 81.4% | 58.7% |
| Maximum | 100.0% | 100.0% |
| Range | 18.6% | 41.3% |
| Mean | 93.5% | 86.0% |
| Median | 93.8% | 86.3% |
| Interquartile 25% (IQ1) | 90.7% | 82.7% |
| Interquartile 75% (IQ3) | 96.7% | 90.2% |
| Interquartile Range (IQR) | 6.0% | 7.5% |
| Standard Deviation (Sample) | 4.6% | 8.2% |
| Standard Deviation (Population) | 4.6% | 8.2% |
Similar Demographics by 10th Grade
Demographics Similar to Navajo by 10th Grade
In terms of 10th grade, the demographic groups most similar to Navajo are Barbadian (92.2%, a difference of 0.040%), Native/Alaskan (92.2%, a difference of 0.040%), Immigrants from Trinidad and Tobago (92.3%, a difference of 0.070%), Malaysian (92.2%, a difference of 0.070%), and Bangladeshi (92.2%, a difference of 0.080%).
| Demographics | Rating | Rank | 10th Grade |
| Immigrants | Uruguay | 0.3 /100 | #270 | Tragic 92.5% |
| Immigrants | Eritrea | 0.3 /100 | #271 | Tragic 92.5% |
| Immigrants | Western Africa | 0.3 /100 | #272 | Tragic 92.5% |
| Trinidadians and Tobagonians | 0.2 /100 | #273 | Tragic 92.4% |
| Immigrants | Congo | 0.2 /100 | #274 | Tragic 92.4% |
| West Indians | 0.2 /100 | #275 | Tragic 92.4% |
| Immigrants | Trinidad and Tobago | 0.1 /100 | #276 | Tragic 92.3% |
| Navajo | 0.1 /100 | #277 | Tragic 92.3% |
| Barbadians | 0.1 /100 | #278 | Tragic 92.2% |
| Natives/Alaskans | 0.1 /100 | #279 | Tragic 92.2% |
| Malaysians | 0.1 /100 | #280 | Tragic 92.2% |
| Bangladeshis | 0.1 /100 | #281 | Tragic 92.2% |
| Immigrants | Peru | 0.1 /100 | #282 | Tragic 92.2% |
| Immigrants | St. Vincent and the Grenadines | 0.0 /100 | #283 | Tragic 92.1% |
| Immigrants | Barbados | 0.0 /100 | #284 | Tragic 92.1% |
Demographics Similar to Immigrants from Honduras by 10th Grade
In terms of 10th grade, the demographic groups most similar to Immigrants from Honduras are Central American (88.4%, a difference of 0.15%), Immigrants from Dominican Republic (88.7%, a difference of 0.19%), Immigrants from Latin America (88.3%, a difference of 0.21%), Hispanic or Latino (88.9%, a difference of 0.37%), and Honduran (89.0%, a difference of 0.49%).
| Demographics | Rating | Rank | 10th Grade |
| Dominicans | 0.0 /100 | #329 | Tragic 89.4% |
| Immigrants | Yemen | 0.0 /100 | #330 | Tragic 89.1% |
| Mexican American Indians | 0.0 /100 | #331 | Tragic 89.0% |
| Immigrants | Azores | 0.0 /100 | #332 | Tragic 89.0% |
| Hondurans | 0.0 /100 | #333 | Tragic 89.0% |
| Hispanics or Latinos | 0.0 /100 | #334 | Tragic 88.9% |
| Immigrants | Dominican Republic | 0.0 /100 | #335 | Tragic 88.7% |
| Immigrants | Honduras | 0.0 /100 | #336 | Tragic 88.5% |
| Central Americans | 0.0 /100 | #337 | Tragic 88.4% |
| Immigrants | Latin America | 0.0 /100 | #338 | Tragic 88.3% |
| Guatemalans | 0.0 /100 | #339 | Tragic 87.9% |
| Mexicans | 0.0 /100 | #340 | Tragic 87.8% |
| Salvadorans | 0.0 /100 | #341 | Tragic 87.5% |
| Immigrants | Guatemala | 0.0 /100 | #342 | Tragic 87.4% |
| Yakama | 0.0 /100 | #343 | Tragic 86.9% |