Navajo vs Bermudan Single Father Households
COMPARE
Navajo
Bermudan
Single Father Households
Single Father Households Comparison
Navajo
Bermudans
3.2%
SINGLE FATHER HOUSEHOLDS
0.0/ 100
METRIC RATING
331st/ 347
METRIC RANK
2.1%
SINGLE FATHER HOUSEHOLDS
99.2/ 100
METRIC RATING
95th/ 347
METRIC RANK
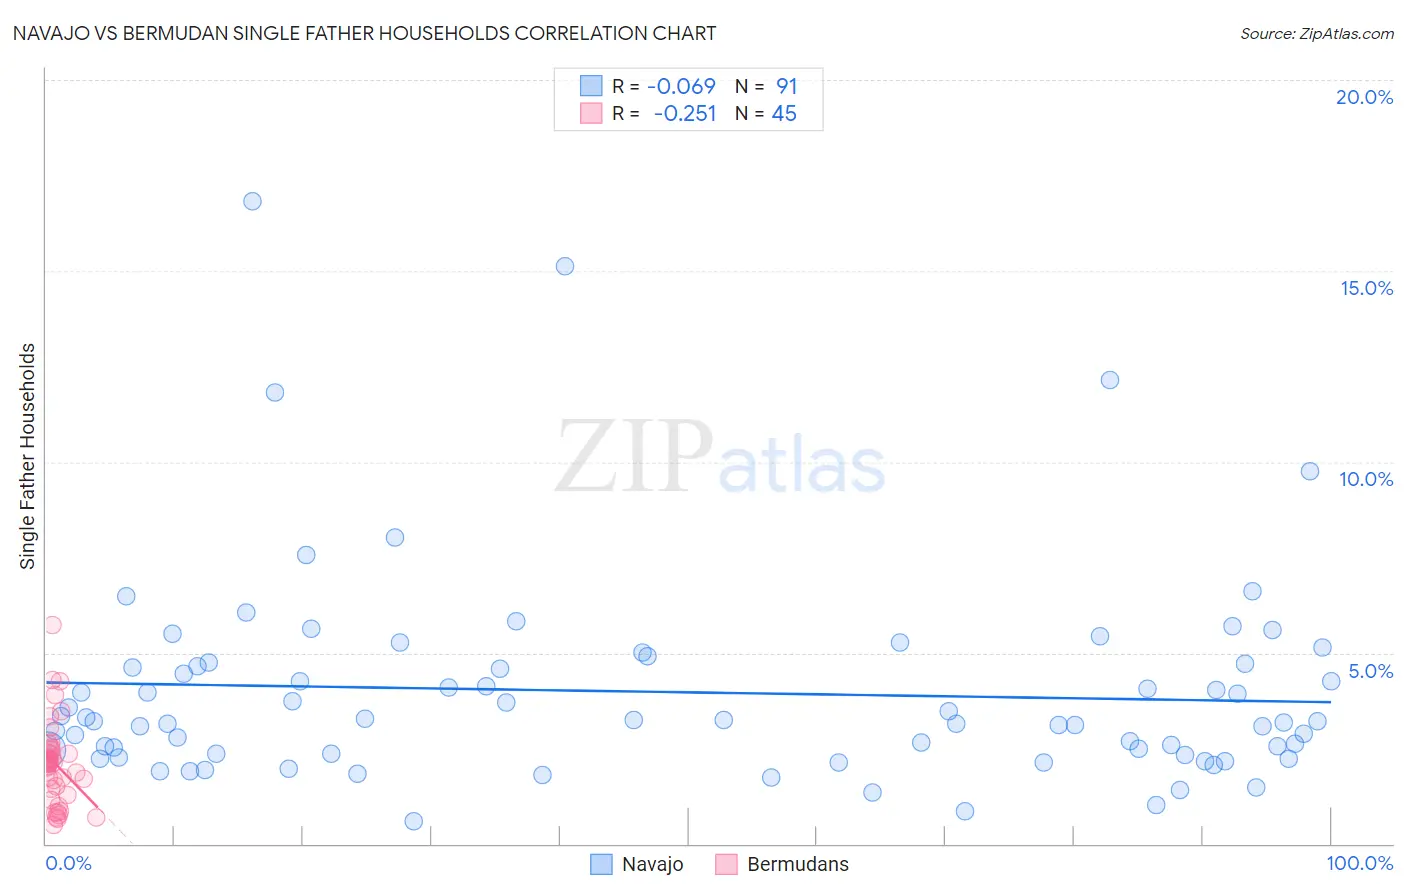
Navajo vs Bermudan Single Father Households Correlation Chart
The statistical analysis conducted on geographies consisting of 223,786,541 people shows a slight negative correlation between the proportion of Navajo and percentage of single father households in the United States with a correlation coefficient (R) of -0.069 and weighted average of 3.2%. Similarly, the statistical analysis conducted on geographies consisting of 55,647,509 people shows a weak negative correlation between the proportion of Bermudans and percentage of single father households in the United States with a correlation coefficient (R) of -0.251 and weighted average of 2.1%, a difference of 49.8%.
Single Father Households Correlation Summary
| Measurement | Navajo | Bermudan |
| Minimum | 0.57% | 0.51% |
| Maximum | 16.8% | 5.7% |
| Range | 16.2% | 5.2% |
| Mean | 4.0% | 2.1% |
| Median | 3.2% | 2.1% |
| Interquartile 25% (IQ1) | 2.4% | 1.4% |
| Interquartile 75% (IQ3) | 4.7% | 2.5% |
| Interquartile Range (IQR) | 2.4% | 1.1% |
| Standard Deviation (Sample) | 2.7% | 1.1% |
| Standard Deviation (Population) | 2.7% | 1.1% |
Similar Demographics by Single Father Households
Demographics Similar to Navajo by Single Father Households
In terms of single father households, the demographic groups most similar to Navajo are Yaqui (3.2%, a difference of 0.040%), Native/Alaskan (3.2%, a difference of 0.54%), Nepalese (3.1%, a difference of 2.3%), Chippewa (3.1%, a difference of 3.2%), and Immigrants from Cabo Verde (3.1%, a difference of 3.3%).
| Demographics | Rating | Rank | Single Father Households |
| Fijians | 0.0 /100 | #324 | Tragic 3.0% |
| Immigrants | Mexico | 0.0 /100 | #325 | Tragic 3.0% |
| Aleuts | 0.0 /100 | #326 | Tragic 3.0% |
| Bangladeshis | 0.0 /100 | #327 | Tragic 3.1% |
| Immigrants | Cabo Verde | 0.0 /100 | #328 | Tragic 3.1% |
| Chippewa | 0.0 /100 | #329 | Tragic 3.1% |
| Nepalese | 0.0 /100 | #330 | Tragic 3.1% |
| Navajo | 0.0 /100 | #331 | Tragic 3.2% |
| Yaqui | 0.0 /100 | #332 | Tragic 3.2% |
| Natives/Alaskans | 0.0 /100 | #333 | Tragic 3.2% |
| Yuman | 0.0 /100 | #334 | Tragic 3.3% |
| Colville | 0.0 /100 | #335 | Tragic 3.3% |
| Paiute | 0.0 /100 | #336 | Tragic 3.3% |
| Pueblo | 0.0 /100 | #337 | Tragic 3.3% |
| Sioux | 0.0 /100 | #338 | Tragic 3.3% |
Demographics Similar to Bermudans by Single Father Households
In terms of single father households, the demographic groups most similar to Bermudans are Arab (2.1%, a difference of 0.14%), Ukrainian (2.1%, a difference of 0.22%), Croatian (2.1%, a difference of 0.23%), Immigrants from Moldova (2.1%, a difference of 0.27%), and Romanian (2.1%, a difference of 0.33%).
| Demographics | Rating | Rank | Single Father Households |
| Bhutanese | 99.5 /100 | #88 | Exceptional 2.1% |
| Immigrants | Armenia | 99.5 /100 | #89 | Exceptional 2.1% |
| Immigrants | Pakistan | 99.5 /100 | #90 | Exceptional 2.1% |
| Immigrants | Guyana | 99.4 /100 | #91 | Exceptional 2.1% |
| Romanians | 99.4 /100 | #92 | Exceptional 2.1% |
| Croatians | 99.3 /100 | #93 | Exceptional 2.1% |
| Ukrainians | 99.3 /100 | #94 | Exceptional 2.1% |
| Bermudans | 99.2 /100 | #95 | Exceptional 2.1% |
| Arabs | 99.2 /100 | #96 | Exceptional 2.1% |
| Immigrants | Moldova | 99.1 /100 | #97 | Exceptional 2.1% |
| Guyanese | 99.1 /100 | #98 | Exceptional 2.1% |
| South Africans | 99.1 /100 | #99 | Exceptional 2.1% |
| Immigrants | Northern Africa | 99.0 /100 | #100 | Exceptional 2.1% |
| Immigrants | Western Europe | 98.9 /100 | #101 | Exceptional 2.1% |
| Argentineans | 98.9 /100 | #102 | Exceptional 2.1% |