Navajo vs Immigrants from Senegal Single Father Households
COMPARE
Navajo
Immigrants from Senegal
Single Father Households
Single Father Households Comparison
Navajo
Immigrants from Senegal
3.2%
SINGLE FATHER HOUSEHOLDS
0.0/ 100
METRIC RATING
331st/ 347
METRIC RANK
2.3%
SINGLE FATHER HOUSEHOLDS
79.4/ 100
METRIC RATING
158th/ 347
METRIC RANK
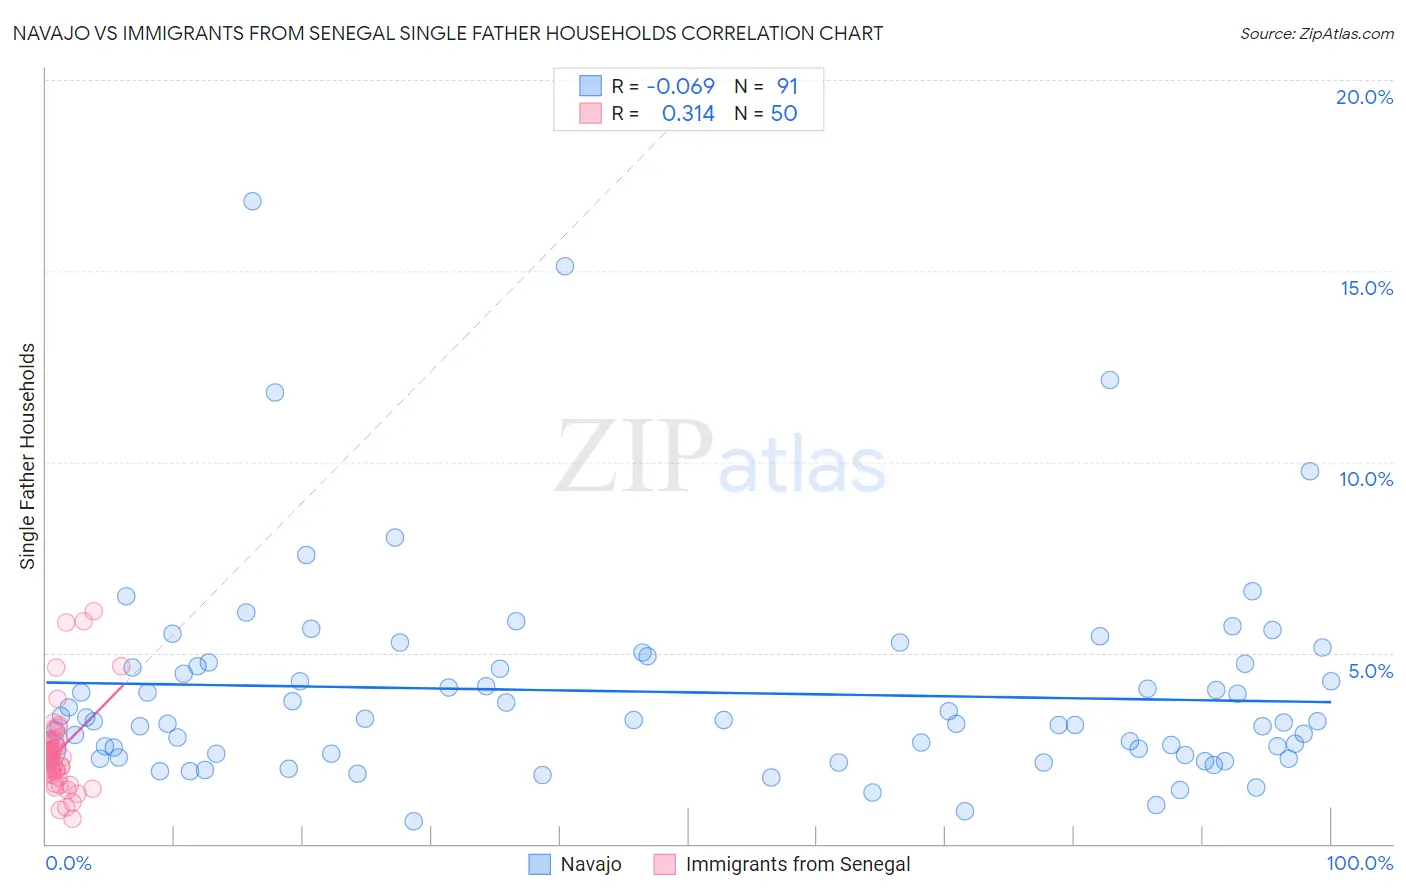
Navajo vs Immigrants from Senegal Single Father Households Correlation Chart
The statistical analysis conducted on geographies consisting of 223,786,541 people shows a slight negative correlation between the proportion of Navajo and percentage of single father households in the United States with a correlation coefficient (R) of -0.069 and weighted average of 3.2%. Similarly, the statistical analysis conducted on geographies consisting of 90,010,834 people shows a mild positive correlation between the proportion of Immigrants from Senegal and percentage of single father households in the United States with a correlation coefficient (R) of 0.314 and weighted average of 2.3%, a difference of 39.9%.
Single Father Households Correlation Summary
| Measurement | Navajo | Immigrants from Senegal |
| Minimum | 0.57% | 0.67% |
| Maximum | 16.8% | 6.1% |
| Range | 16.2% | 5.4% |
| Mean | 4.0% | 2.5% |
| Median | 3.2% | 2.3% |
| Interquartile 25% (IQ1) | 2.4% | 1.8% |
| Interquartile 75% (IQ3) | 4.7% | 2.7% |
| Interquartile Range (IQR) | 2.4% | 0.93% |
| Standard Deviation (Sample) | 2.7% | 1.2% |
| Standard Deviation (Population) | 2.7% | 1.2% |
Similar Demographics by Single Father Households
Demographics Similar to Navajo by Single Father Households
In terms of single father households, the demographic groups most similar to Navajo are Yaqui (3.2%, a difference of 0.040%), Native/Alaskan (3.2%, a difference of 0.54%), Nepalese (3.1%, a difference of 2.3%), Chippewa (3.1%, a difference of 3.2%), and Immigrants from Cabo Verde (3.1%, a difference of 3.3%).
| Demographics | Rating | Rank | Single Father Households |
| Fijians | 0.0 /100 | #324 | Tragic 3.0% |
| Immigrants | Mexico | 0.0 /100 | #325 | Tragic 3.0% |
| Aleuts | 0.0 /100 | #326 | Tragic 3.0% |
| Bangladeshis | 0.0 /100 | #327 | Tragic 3.1% |
| Immigrants | Cabo Verde | 0.0 /100 | #328 | Tragic 3.1% |
| Chippewa | 0.0 /100 | #329 | Tragic 3.1% |
| Nepalese | 0.0 /100 | #330 | Tragic 3.1% |
| Navajo | 0.0 /100 | #331 | Tragic 3.2% |
| Yaqui | 0.0 /100 | #332 | Tragic 3.2% |
| Natives/Alaskans | 0.0 /100 | #333 | Tragic 3.2% |
| Yuman | 0.0 /100 | #334 | Tragic 3.3% |
| Colville | 0.0 /100 | #335 | Tragic 3.3% |
| Paiute | 0.0 /100 | #336 | Tragic 3.3% |
| Pueblo | 0.0 /100 | #337 | Tragic 3.3% |
| Sioux | 0.0 /100 | #338 | Tragic 3.3% |
Demographics Similar to Immigrants from Senegal by Single Father Households
In terms of single father households, the demographic groups most similar to Immigrants from Senegal are Canadian (2.3%, a difference of 0.030%), Immigrants from South America (2.3%, a difference of 0.050%), European (2.3%, a difference of 0.17%), Immigrants from West Indies (2.3%, a difference of 0.17%), and Bolivian (2.3%, a difference of 0.19%).
| Demographics | Rating | Rank | Single Father Households |
| Immigrants | Syria | 84.8 /100 | #151 | Excellent 2.3% |
| Immigrants | Venezuela | 83.2 /100 | #152 | Excellent 2.3% |
| Immigrants | Germany | 82.8 /100 | #153 | Excellent 2.3% |
| Bolivians | 81.0 /100 | #154 | Excellent 2.3% |
| Europeans | 80.9 /100 | #155 | Excellent 2.3% |
| Immigrants | South America | 79.9 /100 | #156 | Good 2.3% |
| Canadians | 79.7 /100 | #157 | Good 2.3% |
| Immigrants | Senegal | 79.4 /100 | #158 | Good 2.3% |
| Immigrants | West Indies | 77.9 /100 | #159 | Good 2.3% |
| Immigrants | Bolivia | 76.3 /100 | #160 | Good 2.3% |
| Swiss | 73.2 /100 | #161 | Good 2.3% |
| Scottish | 72.8 /100 | #162 | Good 2.3% |
| Irish | 72.1 /100 | #163 | Good 2.3% |
| Pakistanis | 70.6 /100 | #164 | Good 2.3% |
| Scotch-Irish | 69.4 /100 | #165 | Good 2.3% |