Moroccan vs Immigrants from Australia Single Father Households
COMPARE
Moroccan
Immigrants from Australia
Single Father Households
Single Father Households Comparison
Moroccans
Immigrants from Australia
2.2%
SINGLE FATHER HOUSEHOLDS
96.9/ 100
METRIC RATING
126th/ 347
METRIC RANK
2.0%
SINGLE FATHER HOUSEHOLDS
100.0/ 100
METRIC RATING
34th/ 347
METRIC RANK
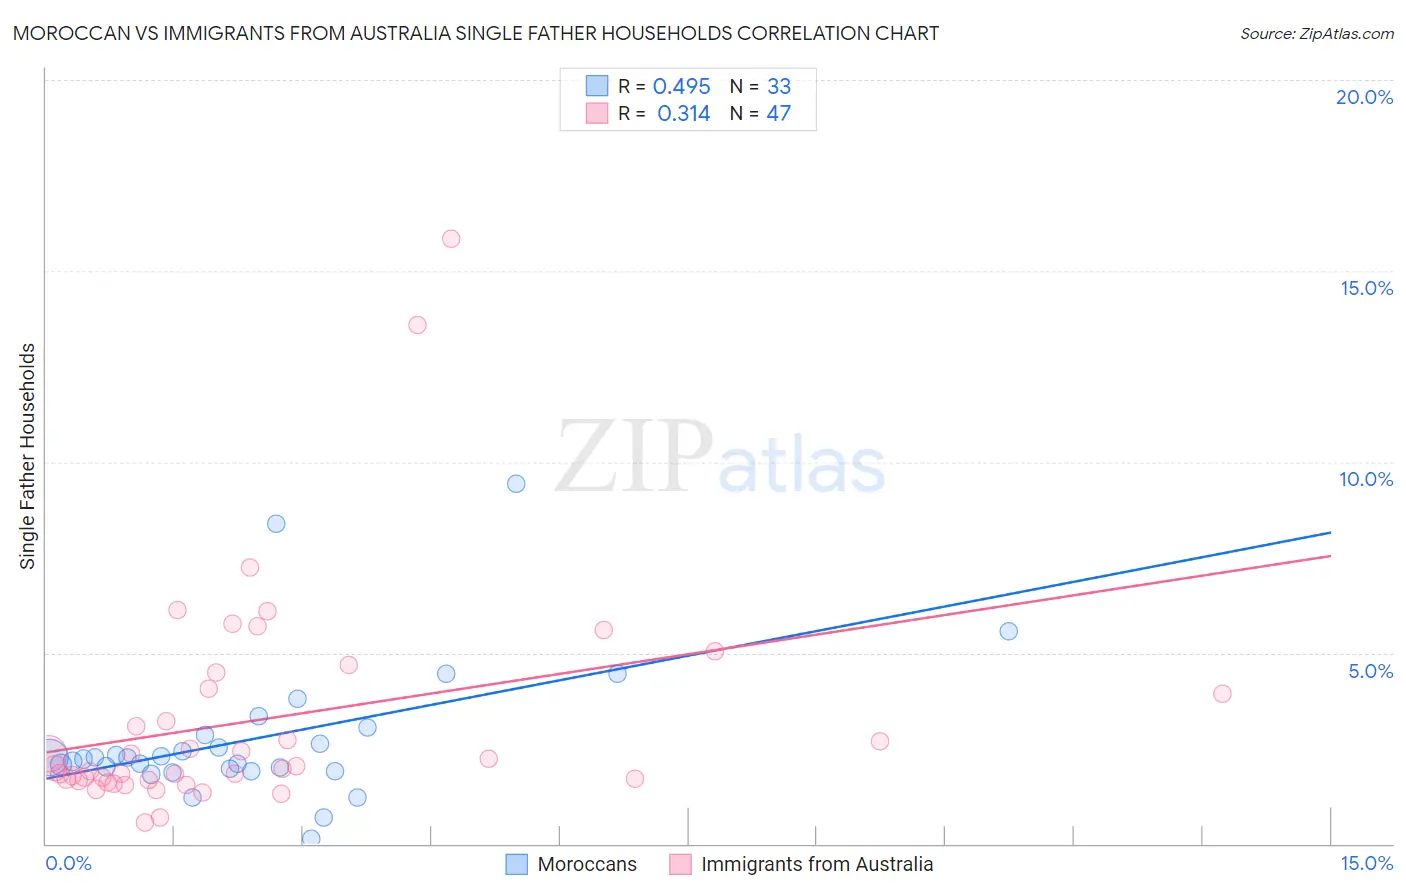
Moroccan vs Immigrants from Australia Single Father Households Correlation Chart
The statistical analysis conducted on geographies consisting of 201,125,863 people shows a moderate positive correlation between the proportion of Moroccans and percentage of single father households in the United States with a correlation coefficient (R) of 0.495 and weighted average of 2.2%. Similarly, the statistical analysis conducted on geographies consisting of 225,821,838 people shows a mild positive correlation between the proportion of Immigrants from Australia and percentage of single father households in the United States with a correlation coefficient (R) of 0.314 and weighted average of 2.0%, a difference of 10.8%.
Single Father Households Correlation Summary
| Measurement | Moroccan | Immigrants from Australia |
| Minimum | 0.13% | 0.57% |
| Maximum | 9.4% | 15.8% |
| Range | 9.3% | 15.3% |
| Mean | 2.8% | 3.2% |
| Median | 2.3% | 2.0% |
| Interquartile 25% (IQ1) | 1.9% | 1.7% |
| Interquartile 75% (IQ3) | 2.9% | 4.1% |
| Interquartile Range (IQR) | 1.0% | 2.4% |
| Standard Deviation (Sample) | 1.9% | 2.9% |
| Standard Deviation (Population) | 1.9% | 2.9% |
Similar Demographics by Single Father Households
Demographics Similar to Moroccans by Single Father Households
In terms of single father households, the demographic groups most similar to Moroccans are Jordanian (2.2%, a difference of 0.0%), Immigrants from England (2.2%, a difference of 0.050%), Serbian (2.2%, a difference of 0.060%), Immigrants from Chile (2.2%, a difference of 0.17%), and Immigrants from Jordan (2.2%, a difference of 0.23%).
| Demographics | Rating | Rank | Single Father Households |
| Trinidadians and Tobagonians | 97.8 /100 | #119 | Exceptional 2.2% |
| Australians | 97.7 /100 | #120 | Exceptional 2.2% |
| Immigrants | Brazil | 97.7 /100 | #121 | Exceptional 2.2% |
| Immigrants | Iraq | 97.6 /100 | #122 | Exceptional 2.2% |
| Immigrants | Yemen | 97.5 /100 | #123 | Exceptional 2.2% |
| British West Indians | 97.4 /100 | #124 | Exceptional 2.2% |
| Immigrants | Indonesia | 97.4 /100 | #125 | Exceptional 2.2% |
| Moroccans | 96.9 /100 | #126 | Exceptional 2.2% |
| Jordanians | 96.9 /100 | #127 | Exceptional 2.2% |
| Immigrants | England | 96.8 /100 | #128 | Exceptional 2.2% |
| Serbians | 96.8 /100 | #129 | Exceptional 2.2% |
| Immigrants | Chile | 96.7 /100 | #130 | Exceptional 2.2% |
| Immigrants | Jordan | 96.6 /100 | #131 | Exceptional 2.2% |
| Poles | 96.5 /100 | #132 | Exceptional 2.2% |
| Taiwanese | 96.3 /100 | #133 | Exceptional 2.2% |
Demographics Similar to Immigrants from Australia by Single Father Households
In terms of single father households, the demographic groups most similar to Immigrants from Australia are Turkish (2.0%, a difference of 0.020%), Chinese (2.0%, a difference of 0.23%), Israeli (2.0%, a difference of 0.28%), Cambodian (2.0%, a difference of 0.31%), and Albanian (2.0%, a difference of 0.32%).
| Demographics | Rating | Rank | Single Father Households |
| Immigrants | South Central Asia | 100.0 /100 | #27 | Exceptional 2.0% |
| Immigrants | Japan | 100.0 /100 | #28 | Exceptional 2.0% |
| Bulgarians | 100.0 /100 | #29 | Exceptional 2.0% |
| Cambodians | 100.0 /100 | #30 | Exceptional 2.0% |
| Israelis | 100.0 /100 | #31 | Exceptional 2.0% |
| Chinese | 100.0 /100 | #32 | Exceptional 2.0% |
| Turks | 100.0 /100 | #33 | Exceptional 2.0% |
| Immigrants | Australia | 100.0 /100 | #34 | Exceptional 2.0% |
| Albanians | 100.0 /100 | #35 | Exceptional 2.0% |
| Immigrants | Belgium | 100.0 /100 | #36 | Exceptional 2.0% |
| Immigrants | St. Vincent and the Grenadines | 100.0 /100 | #37 | Exceptional 2.0% |
| Immigrants | Eastern Europe | 100.0 /100 | #38 | Exceptional 2.0% |
| Immigrants | Sri Lanka | 100.0 /100 | #39 | Exceptional 2.0% |
| Immigrants | Bulgaria | 100.0 /100 | #40 | Exceptional 2.0% |
| Immigrants | Turkey | 100.0 /100 | #41 | Exceptional 2.0% |