Bahamian vs Immigrants from Australia Single Father Households
COMPARE
Bahamian
Immigrants from Australia
Single Father Households
Single Father Households Comparison
Bahamians
Immigrants from Australia
2.5%
SINGLE FATHER HOUSEHOLDS
2.4/ 100
METRIC RATING
248th/ 347
METRIC RANK
2.0%
SINGLE FATHER HOUSEHOLDS
100.0/ 100
METRIC RATING
34th/ 347
METRIC RANK
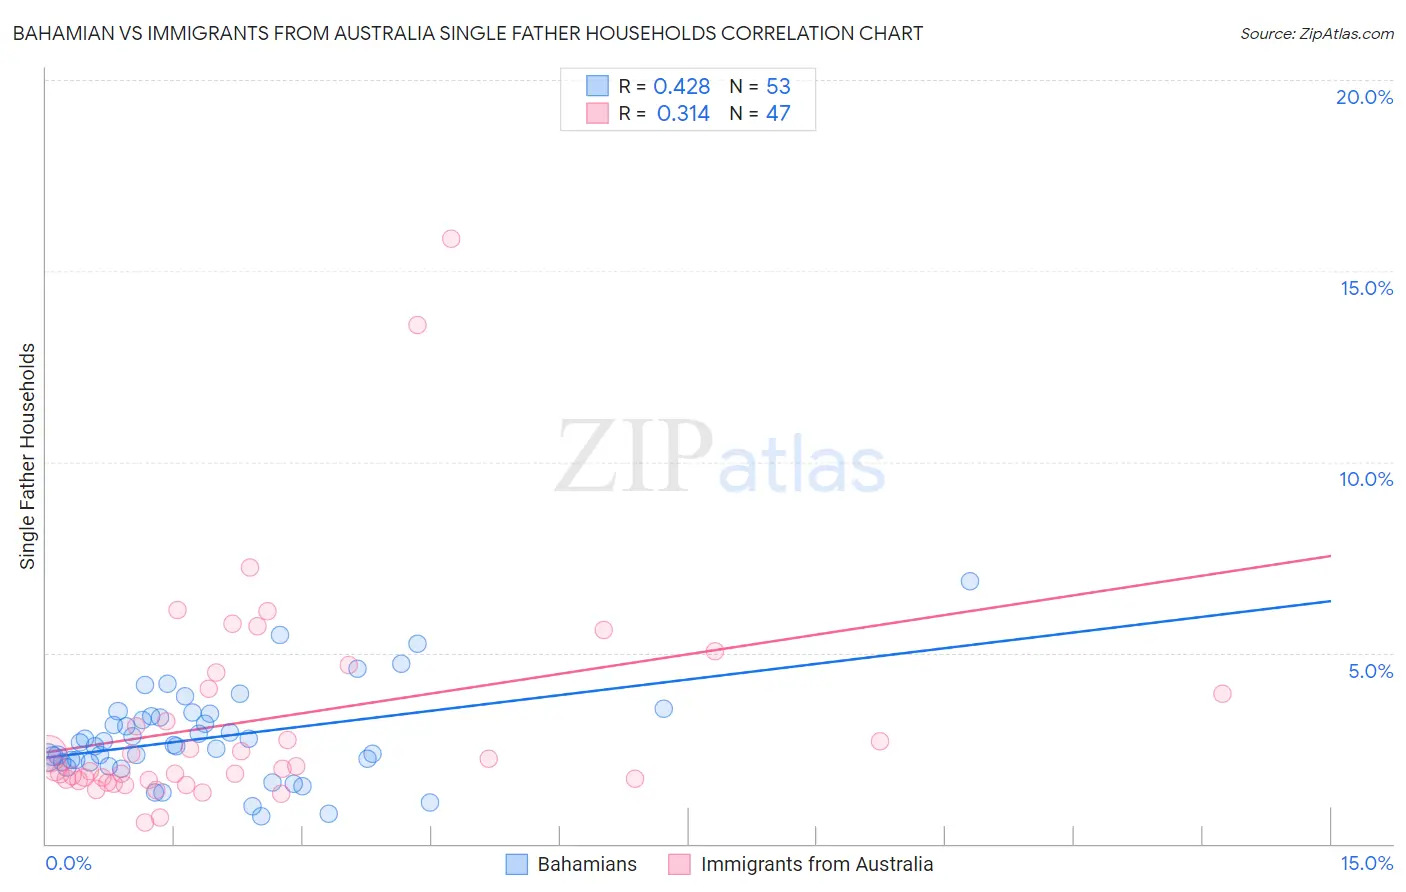
Bahamian vs Immigrants from Australia Single Father Households Correlation Chart
The statistical analysis conducted on geographies consisting of 112,214,100 people shows a moderate positive correlation between the proportion of Bahamians and percentage of single father households in the United States with a correlation coefficient (R) of 0.428 and weighted average of 2.5%. Similarly, the statistical analysis conducted on geographies consisting of 225,821,838 people shows a mild positive correlation between the proportion of Immigrants from Australia and percentage of single father households in the United States with a correlation coefficient (R) of 0.314 and weighted average of 2.0%, a difference of 26.3%.
Single Father Households Correlation Summary
| Measurement | Bahamian | Immigrants from Australia |
| Minimum | 0.72% | 0.57% |
| Maximum | 6.9% | 15.8% |
| Range | 6.2% | 15.3% |
| Mean | 2.8% | 3.2% |
| Median | 2.6% | 2.0% |
| Interquartile 25% (IQ1) | 2.1% | 1.7% |
| Interquartile 75% (IQ3) | 3.4% | 4.1% |
| Interquartile Range (IQR) | 1.2% | 2.4% |
| Standard Deviation (Sample) | 1.2% | 2.9% |
| Standard Deviation (Population) | 1.2% | 2.9% |
Similar Demographics by Single Father Households
Demographics Similar to Bahamians by Single Father Households
In terms of single father households, the demographic groups most similar to Bahamians are Delaware (2.5%, a difference of 0.040%), Native Hawaiian (2.5%, a difference of 0.060%), Basque (2.5%, a difference of 0.080%), Immigrants from Cameroon (2.5%, a difference of 0.090%), and Somali (2.5%, a difference of 0.25%).
| Demographics | Rating | Rank | Single Father Households |
| Portuguese | 4.1 /100 | #241 | Tragic 2.5% |
| Osage | 4.1 /100 | #242 | Tragic 2.5% |
| Spaniards | 3.1 /100 | #243 | Tragic 2.5% |
| Immigrants | Middle Africa | 2.8 /100 | #244 | Tragic 2.5% |
| Basques | 2.5 /100 | #245 | Tragic 2.5% |
| Native Hawaiians | 2.5 /100 | #246 | Tragic 2.5% |
| Delaware | 2.5 /100 | #247 | Tragic 2.5% |
| Bahamians | 2.4 /100 | #248 | Tragic 2.5% |
| Immigrants | Cameroon | 2.3 /100 | #249 | Tragic 2.5% |
| Somalis | 2.1 /100 | #250 | Tragic 2.5% |
| Liberians | 2.0 /100 | #251 | Tragic 2.5% |
| Immigrants | Eritrea | 2.0 /100 | #252 | Tragic 2.5% |
| Immigrants | Somalia | 1.9 /100 | #253 | Tragic 2.5% |
| Immigrants | Thailand | 1.8 /100 | #254 | Tragic 2.5% |
| Tongans | 1.5 /100 | #255 | Tragic 2.5% |
Demographics Similar to Immigrants from Australia by Single Father Households
In terms of single father households, the demographic groups most similar to Immigrants from Australia are Turkish (2.0%, a difference of 0.020%), Chinese (2.0%, a difference of 0.23%), Israeli (2.0%, a difference of 0.28%), Cambodian (2.0%, a difference of 0.31%), and Albanian (2.0%, a difference of 0.32%).
| Demographics | Rating | Rank | Single Father Households |
| Immigrants | South Central Asia | 100.0 /100 | #27 | Exceptional 2.0% |
| Immigrants | Japan | 100.0 /100 | #28 | Exceptional 2.0% |
| Bulgarians | 100.0 /100 | #29 | Exceptional 2.0% |
| Cambodians | 100.0 /100 | #30 | Exceptional 2.0% |
| Israelis | 100.0 /100 | #31 | Exceptional 2.0% |
| Chinese | 100.0 /100 | #32 | Exceptional 2.0% |
| Turks | 100.0 /100 | #33 | Exceptional 2.0% |
| Immigrants | Australia | 100.0 /100 | #34 | Exceptional 2.0% |
| Albanians | 100.0 /100 | #35 | Exceptional 2.0% |
| Immigrants | Belgium | 100.0 /100 | #36 | Exceptional 2.0% |
| Immigrants | St. Vincent and the Grenadines | 100.0 /100 | #37 | Exceptional 2.0% |
| Immigrants | Eastern Europe | 100.0 /100 | #38 | Exceptional 2.0% |
| Immigrants | Sri Lanka | 100.0 /100 | #39 | Exceptional 2.0% |
| Immigrants | Bulgaria | 100.0 /100 | #40 | Exceptional 2.0% |
| Immigrants | Turkey | 100.0 /100 | #41 | Exceptional 2.0% |