French vs Immigrants from Australia Single Father Households
COMPARE
French
Immigrants from Australia
Single Father Households
Single Father Households Comparison
French
Immigrants from Australia
2.4%
SINGLE FATHER HOUSEHOLDS
31.7/ 100
METRIC RATING
190th/ 347
METRIC RANK
2.0%
SINGLE FATHER HOUSEHOLDS
100.0/ 100
METRIC RATING
34th/ 347
METRIC RANK
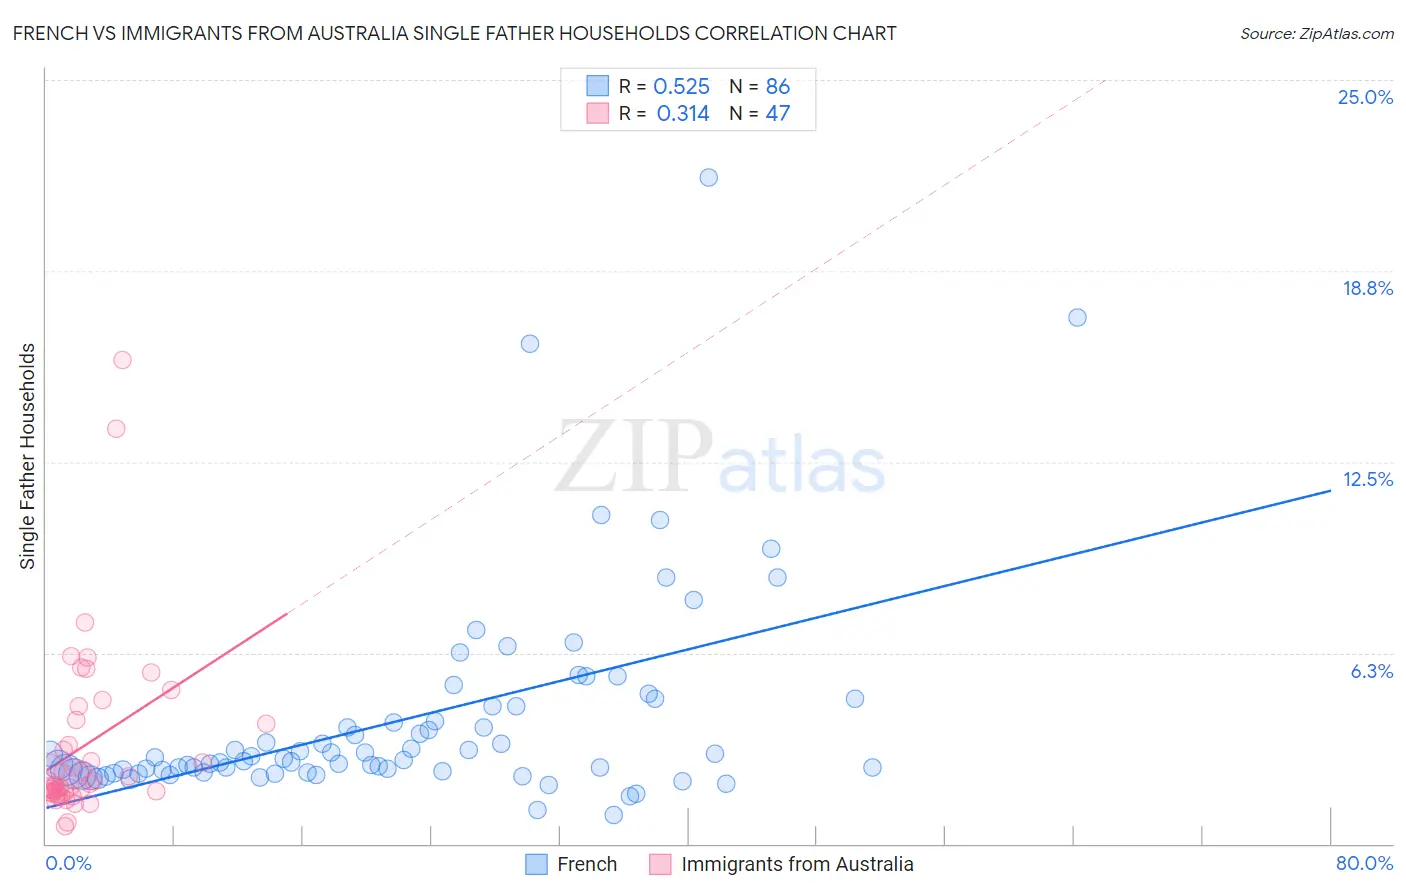
French vs Immigrants from Australia Single Father Households Correlation Chart
The statistical analysis conducted on geographies consisting of 557,216,183 people shows a substantial positive correlation between the proportion of French and percentage of single father households in the United States with a correlation coefficient (R) of 0.525 and weighted average of 2.4%. Similarly, the statistical analysis conducted on geographies consisting of 225,821,838 people shows a mild positive correlation between the proportion of Immigrants from Australia and percentage of single father households in the United States with a correlation coefficient (R) of 0.314 and weighted average of 2.0%, a difference of 19.9%.
Single Father Households Correlation Summary
| Measurement | French | Immigrants from Australia |
| Minimum | 0.93% | 0.57% |
| Maximum | 21.8% | 15.8% |
| Range | 20.9% | 15.3% |
| Mean | 4.1% | 3.2% |
| Median | 2.8% | 2.0% |
| Interquartile 25% (IQ1) | 2.3% | 1.7% |
| Interquartile 75% (IQ3) | 4.5% | 4.1% |
| Interquartile Range (IQR) | 2.2% | 2.4% |
| Standard Deviation (Sample) | 3.4% | 2.9% |
| Standard Deviation (Population) | 3.4% | 2.9% |
Similar Demographics by Single Father Households
Demographics Similar to French by Single Father Households
In terms of single father households, the demographic groups most similar to French are U.S. Virgin Islander (2.4%, a difference of 0.0%), Hmong (2.4%, a difference of 0.11%), Immigrants from Africa (2.4%, a difference of 0.15%), Immigrants from Sudan (2.4%, a difference of 0.16%), and Uruguayan (2.4%, a difference of 0.17%).
| Demographics | Rating | Rank | Single Father Households |
| Immigrants | Panama | 41.8 /100 | #183 | Average 2.4% |
| Sri Lankans | 41.8 /100 | #184 | Average 2.4% |
| Nigerians | 41.0 /100 | #185 | Average 2.4% |
| Immigrants | Bosnia and Herzegovina | 40.4 /100 | #186 | Average 2.4% |
| Immigrants | Colombia | 34.0 /100 | #187 | Fair 2.4% |
| Hmong | 33.0 /100 | #188 | Fair 2.4% |
| U.S. Virgin Islanders | 31.8 /100 | #189 | Fair 2.4% |
| French | 31.7 /100 | #190 | Fair 2.4% |
| Immigrants | Africa | 30.0 /100 | #191 | Fair 2.4% |
| Immigrants | Sudan | 29.8 /100 | #192 | Fair 2.4% |
| Uruguayans | 29.7 /100 | #193 | Fair 2.4% |
| Panamanians | 29.6 /100 | #194 | Fair 2.4% |
| Immigrants | Philippines | 28.7 /100 | #195 | Fair 2.4% |
| Kenyans | 28.0 /100 | #196 | Fair 2.4% |
| Germans | 28.0 /100 | #197 | Fair 2.4% |
Demographics Similar to Immigrants from Australia by Single Father Households
In terms of single father households, the demographic groups most similar to Immigrants from Australia are Turkish (2.0%, a difference of 0.020%), Chinese (2.0%, a difference of 0.23%), Israeli (2.0%, a difference of 0.28%), Cambodian (2.0%, a difference of 0.31%), and Albanian (2.0%, a difference of 0.32%).
| Demographics | Rating | Rank | Single Father Households |
| Immigrants | South Central Asia | 100.0 /100 | #27 | Exceptional 2.0% |
| Immigrants | Japan | 100.0 /100 | #28 | Exceptional 2.0% |
| Bulgarians | 100.0 /100 | #29 | Exceptional 2.0% |
| Cambodians | 100.0 /100 | #30 | Exceptional 2.0% |
| Israelis | 100.0 /100 | #31 | Exceptional 2.0% |
| Chinese | 100.0 /100 | #32 | Exceptional 2.0% |
| Turks | 100.0 /100 | #33 | Exceptional 2.0% |
| Immigrants | Australia | 100.0 /100 | #34 | Exceptional 2.0% |
| Albanians | 100.0 /100 | #35 | Exceptional 2.0% |
| Immigrants | Belgium | 100.0 /100 | #36 | Exceptional 2.0% |
| Immigrants | St. Vincent and the Grenadines | 100.0 /100 | #37 | Exceptional 2.0% |
| Immigrants | Eastern Europe | 100.0 /100 | #38 | Exceptional 2.0% |
| Immigrants | Sri Lanka | 100.0 /100 | #39 | Exceptional 2.0% |
| Immigrants | Bulgaria | 100.0 /100 | #40 | Exceptional 2.0% |
| Immigrants | Turkey | 100.0 /100 | #41 | Exceptional 2.0% |