Native/Alaskan vs Immigrants from Cuba Family Households with Children
COMPARE
Native/Alaskan
Immigrants from Cuba
Family Households with Children
Family Households with Children Comparison
Natives/Alaskans
Immigrants from Cuba
28.4%
FAMILY HOUSEHOLDS WITH CHILDREN
99.8/ 100
METRIC RATING
80th/ 347
METRIC RANK
26.8%
FAMILY HOUSEHOLDS WITH CHILDREN
1.3/ 100
METRIC RATING
258th/ 347
METRIC RANK
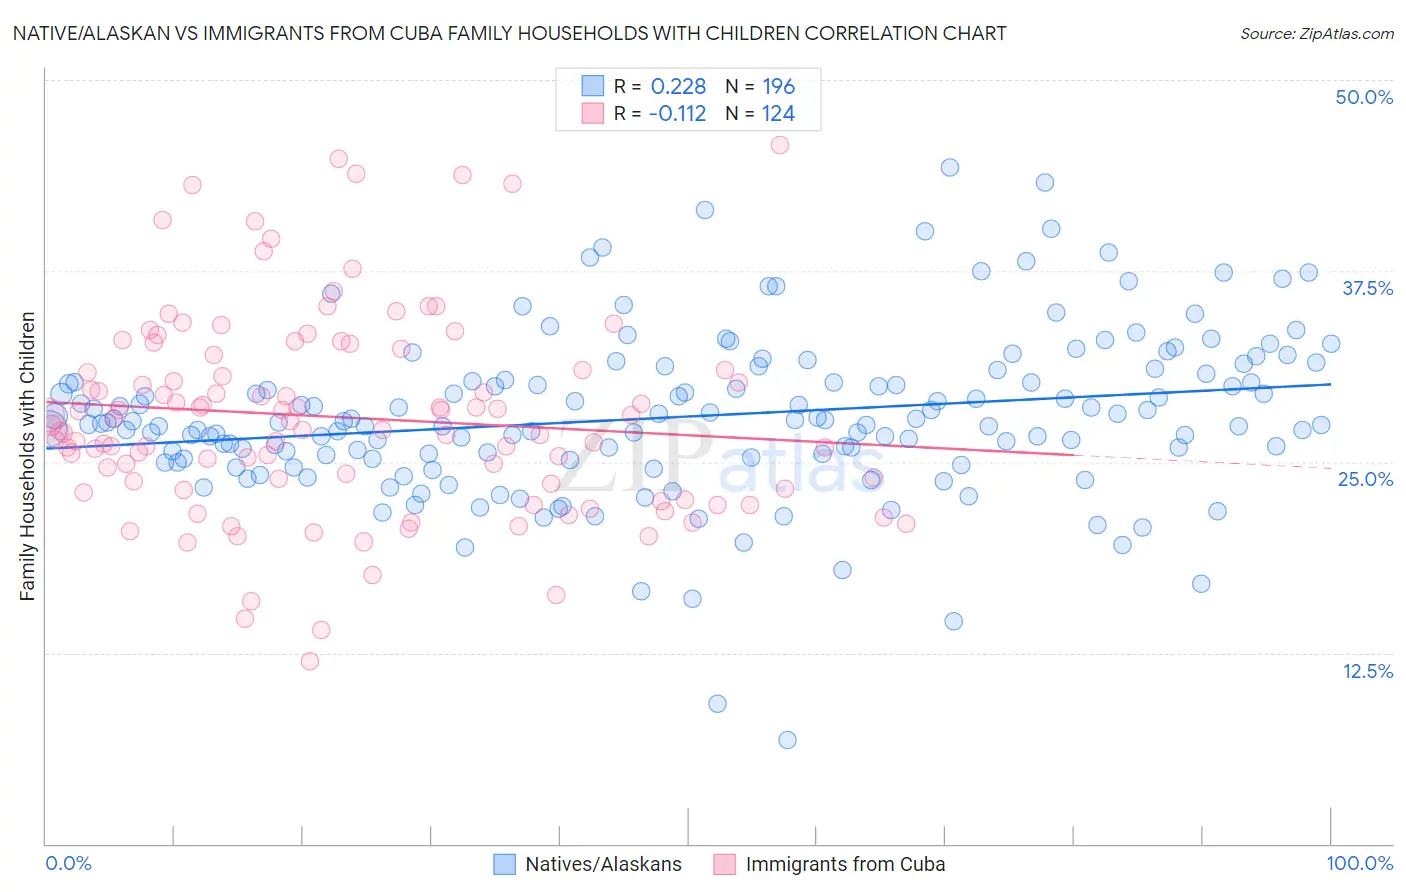
Native/Alaskan vs Immigrants from Cuba Family Households with Children Correlation Chart
The statistical analysis conducted on geographies consisting of 512,450,459 people shows a weak positive correlation between the proportion of Natives/Alaskans and percentage of family households with children in the United States with a correlation coefficient (R) of 0.228 and weighted average of 28.4%. Similarly, the statistical analysis conducted on geographies consisting of 325,830,248 people shows a poor negative correlation between the proportion of Immigrants from Cuba and percentage of family households with children in the United States with a correlation coefficient (R) of -0.112 and weighted average of 26.8%, a difference of 6.0%.
Family Households with Children Correlation Summary
| Measurement | Native/Alaskan | Immigrants from Cuba |
| Minimum | 6.8% | 11.9% |
| Maximum | 44.2% | 45.7% |
| Range | 37.4% | 33.8% |
| Mean | 28.0% | 27.9% |
| Median | 27.6% | 27.3% |
| Interquartile 25% (IQ1) | 25.2% | 23.4% |
| Interquartile 75% (IQ3) | 30.3% | 31.5% |
| Interquartile Range (IQR) | 5.1% | 8.1% |
| Standard Deviation (Sample) | 5.4% | 6.6% |
| Standard Deviation (Population) | 5.4% | 6.6% |
Similar Demographics by Family Households with Children
Demographics Similar to Natives/Alaskans by Family Households with Children
In terms of family households with children, the demographic groups most similar to Natives/Alaskans are Immigrants from Iraq (28.4%, a difference of 0.010%), South American (28.4%, a difference of 0.020%), Immigrants from Nepal (28.4%, a difference of 0.040%), Kenyan (28.4%, a difference of 0.070%), and Nigerian (28.4%, a difference of 0.080%).
| Demographics | Rating | Rank | Family Households with Children |
| Iraqis | 99.9 /100 | #73 | Exceptional 28.5% |
| Laotians | 99.9 /100 | #74 | Exceptional 28.5% |
| Immigrants | Jordan | 99.9 /100 | #75 | Exceptional 28.4% |
| Immigrants | Sri Lanka | 99.9 /100 | #76 | Exceptional 28.4% |
| Nigerians | 99.8 /100 | #77 | Exceptional 28.4% |
| Immigrants | Nepal | 99.8 /100 | #78 | Exceptional 28.4% |
| Immigrants | Iraq | 99.8 /100 | #79 | Exceptional 28.4% |
| Natives/Alaskans | 99.8 /100 | #80 | Exceptional 28.4% |
| South Americans | 99.8 /100 | #81 | Exceptional 28.4% |
| Kenyans | 99.8 /100 | #82 | Exceptional 28.4% |
| Nicaraguans | 99.8 /100 | #83 | Exceptional 28.4% |
| Costa Ricans | 99.8 /100 | #84 | Exceptional 28.4% |
| Immigrants | Syria | 99.8 /100 | #85 | Exceptional 28.4% |
| Immigrants | Western Africa | 99.6 /100 | #86 | Exceptional 28.3% |
| Colombians | 99.6 /100 | #87 | Exceptional 28.3% |
Demographics Similar to Immigrants from Cuba by Family Households with Children
In terms of family households with children, the demographic groups most similar to Immigrants from Cuba are Slavic (26.8%, a difference of 0.010%), Immigrants from Lithuania (26.8%, a difference of 0.030%), Scotch-Irish (26.8%, a difference of 0.050%), Immigrants from Jamaica (26.8%, a difference of 0.050%), and Immigrants from Scotland (26.8%, a difference of 0.070%).
| Demographics | Rating | Rank | Family Households with Children |
| Immigrants | Bosnia and Herzegovina | 1.9 /100 | #251 | Tragic 26.8% |
| Irish | 1.8 /100 | #252 | Tragic 26.8% |
| Italians | 1.5 /100 | #253 | Tragic 26.8% |
| Immigrants | Scotland | 1.5 /100 | #254 | Tragic 26.8% |
| German Russians | 1.5 /100 | #255 | Tragic 26.8% |
| Scotch-Irish | 1.4 /100 | #256 | Tragic 26.8% |
| Slavs | 1.3 /100 | #257 | Tragic 26.8% |
| Immigrants | Cuba | 1.3 /100 | #258 | Tragic 26.8% |
| Immigrants | Lithuania | 1.2 /100 | #259 | Tragic 26.8% |
| Immigrants | Jamaica | 1.2 /100 | #260 | Tragic 26.8% |
| Immigrants | Belarus | 1.1 /100 | #261 | Tragic 26.8% |
| Immigrants | Russia | 1.0 /100 | #262 | Tragic 26.8% |
| Immigrants | North Macedonia | 1.0 /100 | #263 | Tragic 26.7% |
| Taiwanese | 0.9 /100 | #264 | Tragic 26.7% |
| Chippewa | 0.9 /100 | #265 | Tragic 26.7% |