Native/Alaskan vs U.S. Virgin Islander Family Households with Children

COMPARE

Native/Alaskan
Race
Ancestry
AfghanAfricanAlaska NativeAlaskan AthabascanAlbanianAleutAlsatianAmericanApacheArabArapahoArgentineanArmenianAssyrian/Chaldean/SyriacAustralianAustrianBahamianBangladeshiBarbadianBasqueBelgianBelizeanBermudanBhutaneseBlackfeetBolivianBrazilianBritishBritish West IndianBulgarianBurmeseCajunCambodianCanadianCape VerdeanCarpatho RusynCelticCentral AmericanCentral American IndianCherokeeCheyenneChickasawChileanChineseChippewaChoctawColombianColvilleComancheCosta RicanCreeCreekCroatianCrowCubanCypriotCzechCzechoslovakianDanishDelawareDominicanDutchDutch West IndianEastern EuropeanEcuadorianEgyptianEnglishEstonianEthiopianEuropeanFijianFilipinoFinnishFrenchFrench American IndianFrench CanadianGermanGerman RussianGhanaianGreekGuamanian/ChamorroGuatemalanGuyaneseHaitianHmongHonduranHopiHoumaHungarianIcelanderIndian (Asian)IndonesianInupiatIranianIraqiIrishIroquoisIsraeliItalianJamaicanJapaneseJordanianKenyanKiowaKoreanLaotianLatvianLebaneseLiberianLithuanianLumbeeLuxembourgerMacedonianMalaysianMalteseMarshalleseMenomineeMexicanMexican American IndianMongolianMoroccanNative HawaiianNavajoNepaleseNew ZealanderNicaraguanNigerianNorthern EuropeanNorwegianOkinawanOsageOttawaPaiutePakistaniPalestinianPanamanianParaguayanPennsylvania GermanPeruvianPimaPolishPortuguesePotawatomiPuebloPuerto RicanPuget Sound SalishRomanianRussianSalvadoranSamoanScandinavianScotch-IrishScottishSeminoleSenegaleseSerbianShoshoneSierra LeoneanSiouxSlavicSlovakSloveneSomaliSouth AfricanSouth AmericanSouth American IndianSoviet UnionSpaniardSpanishSpanish AmericanSpanish American IndianSri LankanSubsaharan AfricanSudaneseSwedishSwissSyrianTaiwaneseThaiTlingit-HaidaTohono O'OdhamTonganTrinidadian and TobagonianTsimshianTurkishUgandanUkrainianUruguayanUteVenezuelanVietnameseWelshWest IndianYakamaYaquiYugoslavianYumanYup'ikZimbabwean
Immigration
NonimmigrantsImmigrantsAfghanistanAfricaAlbaniaArgentinaArmeniaAsiaAustraliaAustriaBahamasBangladeshBarbadosBelarusBelgiumBelizeBoliviaBosnia and HerzegovinaBrazilBulgariaBurma/MyanmarCabo VerdeCambodiaCameroonCanadaCaribbeanCentral AmericaChileChinaColombiaCongoCosta RicaCroatiaCubaCzechoslovakiaDenmarkDominicaDominican RepublicEastern AfricaEastern AsiaEastern EuropeEcuadorEgyptEl SalvadorEnglandEritreaEthiopiaEuropeFijiFranceGermanyGhanaGreeceGrenadaGuatemalaGuyanaHaitiHondurasHong KongHungaryIndiaIndonesiaIranIraqIrelandIsraelItalyJamaicaJapanJordanKazakhstanKenyaKoreaKuwaitLaosLatin AmericaLatviaLebanonLiberiaLithuaniaMalaysiaMexicoMicronesiaMiddle AfricaMoldovaMoroccoNepalNetherlandsNicaraguaNigeriaNorth AmericaNorth MacedoniaNorthern AfricaNorthern EuropeNorwayOceaniaPakistanPanamaPeruPhilippinesPolandPortugalRomaniaRussiaSaudi ArabiaScotlandSenegalSerbiaSierra LeoneSingaporeSomaliaSouth AfricaSouth AmericaSouth Central AsiaSouth Eastern AsiaSouthern EuropeSpainSri LankaSt. Vincent and the GrenadinesSudanSwedenSwitzerlandSyriaTaiwanThailandTrinidad and TobagoTurkeyUgandaUkraineUruguayUzbekistanVenezuelaVietnamWest IndiesWestern AfricaWestern AsiaWestern EuropeYemenZaireZimbabweAzores
U.S. Virgin Islander
Race
Ancestry
AfghanAfricanAlaska NativeAlaskan AthabascanAlbanianAleutAlsatianAmericanApacheArabArapahoArgentineanArmenianAssyrian/Chaldean/SyriacAustralianAustrianBahamianBangladeshiBarbadianBasqueBelgianBelizeanBermudanBhutaneseBlackfeetBolivianBrazilianBritishBritish West IndianBulgarianBurmeseCajunCambodianCanadianCape VerdeanCarpatho RusynCelticCentral AmericanCentral American IndianCherokeeCheyenneChickasawChileanChineseChippewaChoctawColombianColvilleComancheCosta RicanCreeCreekCroatianCrowCubanCypriotCzechCzechoslovakianDanishDelawareDominicanDutchDutch West IndianEastern EuropeanEcuadorianEgyptianEnglishEstonianEthiopianEuropeanFijianFilipinoFinnishFrenchFrench American IndianFrench CanadianGermanGerman RussianGhanaianGreekGuamanian/ChamorroGuatemalanGuyaneseHaitianHmongHonduranHopiHoumaHungarianIcelanderIndian (Asian)IndonesianInupiatIranianIraqiIrishIroquoisIsraeliItalianJamaicanJapaneseJordanianKenyanKiowaKoreanLaotianLatvianLebaneseLiberianLithuanianLumbeeLuxembourgerMacedonianMalaysianMalteseMarshalleseMenomineeMexicanMexican American IndianMongolianMoroccanNative HawaiianNavajoNepaleseNew ZealanderNicaraguanNigerianNorthern EuropeanNorwegianOkinawanOsageOttawaPaiutePakistaniPalestinianPanamanianParaguayanPennsylvania GermanPeruvianPimaPolishPortuguesePotawatomiPuebloPuerto RicanPuget Sound SalishRomanianRussianSalvadoranSamoanScandinavianScotch-IrishScottishSeminoleSenegaleseSerbianShoshoneSierra LeoneanSiouxSlavicSlovakSloveneSomaliSouth AfricanSouth AmericanSouth American IndianSoviet UnionSpaniardSpanishSpanish AmericanSpanish American IndianSri LankanSubsaharan AfricanSudaneseSwedishSwissSyrianTaiwaneseThaiTlingit-HaidaTohono O'OdhamTonganTrinidadian and TobagonianTsimshianTurkishU.S. Virgin IslanderUgandanUkrainianUruguayanUteVenezuelanVietnameseWelshWest IndianYakamaYaquiYugoslavianYumanYup'ikZimbabwean
Immigration
NonimmigrantsImmigrantsAfghanistanAfricaAlbaniaArgentinaArmeniaAsiaAustraliaAustriaBahamasBangladeshBarbadosBelarusBelgiumBelizeBoliviaBosnia and HerzegovinaBrazilBulgariaBurma/MyanmarCabo VerdeCambodiaCameroonCanadaCaribbeanCentral AmericaChileChinaColombiaCongoCosta RicaCroatiaCubaCzechoslovakiaDenmarkDominicaDominican RepublicEastern AfricaEastern AsiaEastern EuropeEcuadorEgyptEl SalvadorEnglandEritreaEthiopiaEuropeFijiFranceGermanyGhanaGreeceGrenadaGuatemalaGuyanaHaitiHondurasHong KongHungaryIndiaIndonesiaIranIraqIrelandIsraelItalyJamaicaJapanJordanKazakhstanKenyaKoreaKuwaitLaosLatin AmericaLatviaLebanonLiberiaLithuaniaMalaysiaMexicoMicronesiaMiddle AfricaMoldovaMoroccoNepalNetherlandsNicaraguaNigeriaNorth AmericaNorth MacedoniaNorthern AfricaNorthern EuropeNorwayOceaniaPakistanPanamaPeruPhilippinesPolandPortugalRomaniaRussiaSaudi ArabiaScotlandSenegalSerbiaSierra LeoneSingaporeSomaliaSouth AfricaSouth AmericaSouth Central AsiaSouth Eastern AsiaSouthern EuropeSpainSri LankaSt. Vincent and the GrenadinesSudanSwedenSwitzerlandSyriaTaiwanThailandTrinidad and TobagoTurkeyUgandaUkraineUruguayUzbekistanVenezuelaVietnamWest IndiesWestern AfricaWestern AsiaWestern EuropeYemenZaireZimbabweAzores
Family Households with Children
Income
Poverty
Unemployment
Labor Participation
Family Structure
Vehicle Availability
Education Level
Disability

Family Households with Children Comparison

Natives/Alaskans

U.S. Virgin Islanders

Exceptional
Poor
28.4%
FAMILY HOUSEHOLDS WITH CHILDREN
99.8/ 100
METRIC RATING
80th/ 347
METRIC RANK
27.1%
FAMILY HOUSEHOLDS WITH CHILDREN
12.1/ 100
METRIC RATING
217th/ 347
METRIC RANK

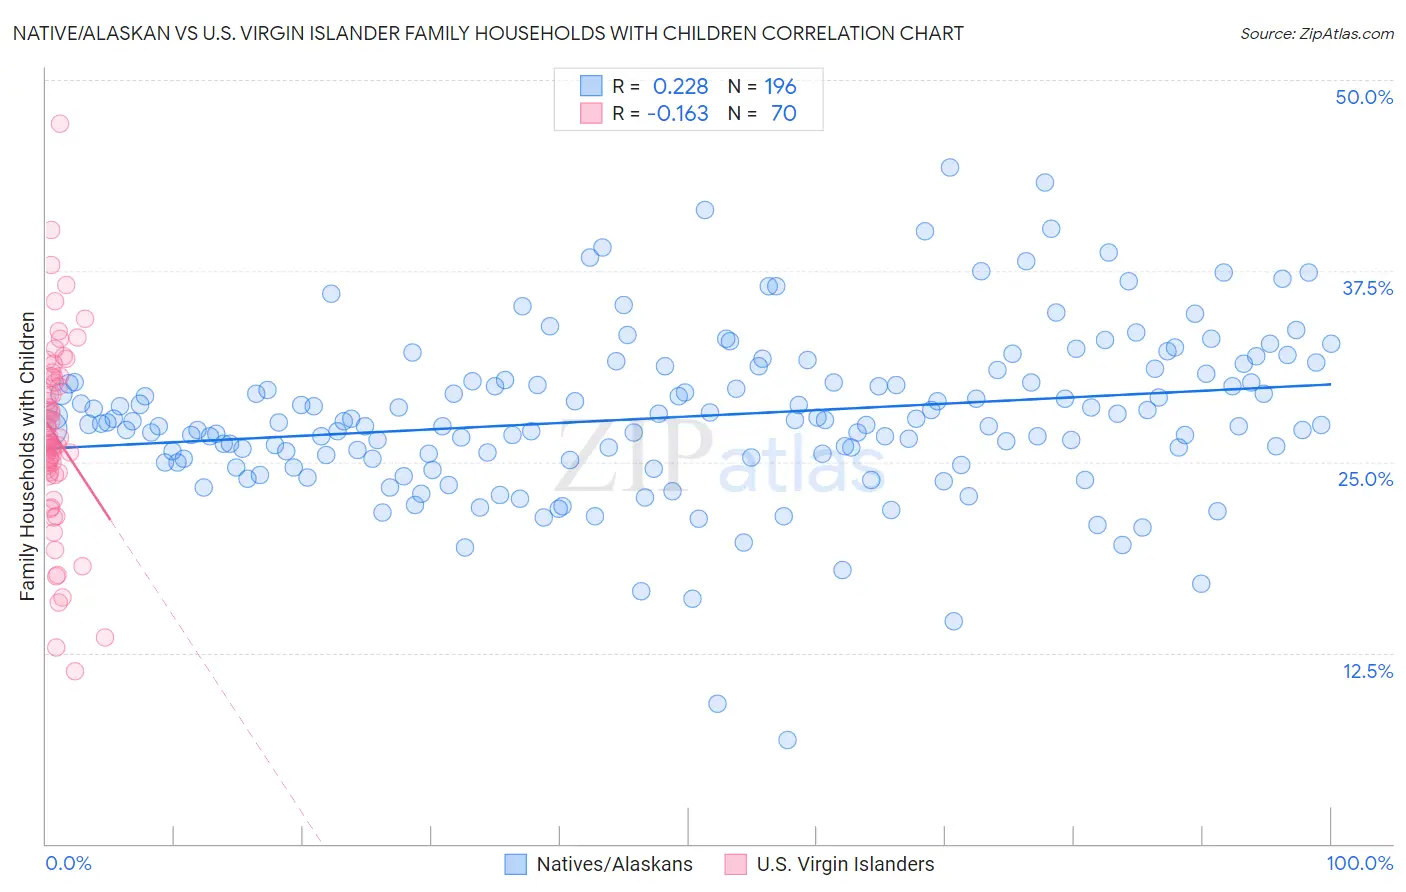
Native/Alaskan vs U.S. Virgin Islander Family Households with Children Correlation Chart

The statistical analysis conducted on geographies consisting of 512,450,459 people shows a weak positive correlation between the proportion of Natives/Alaskans and percentage of family households with children in the United States with a correlation coefficient (R) of 0.228 and weighted average of 28.4%. Similarly, the statistical analysis conducted on geographies consisting of 87,501,464 people shows a poor negative correlation between the proportion of U.S. Virgin Islanders and percentage of family households with children in the United States with a correlation coefficient (R) of -0.163 and weighted average of 27.1%, a difference of 4.6%.
Native/Alaskan vs U.S. Virgin Islander Family Households with Children

Family Households with Children Correlation Summary

MeasurementNative/AlaskanU.S. Virgin Islander
Minimum6.8%11.3%
Maximum44.2%47.1%
Range37.4%35.8%
Mean28.0%26.7%
Median27.6%26.2%
Interquartile 25% (IQ1)25.2%24.3%
Interquartile 75% (IQ3)30.3%30.5%
Interquartile Range (IQR)5.1%6.3%
Standard Deviation (Sample)5.4%6.2%
Standard Deviation (Population)5.4%6.2%

Similar Demographics by Family Households with Children

Demographics Similar to Natives/Alaskans by Family Households with Children

In terms of family households with children, the demographic groups most similar to Natives/Alaskans are Immigrants from Iraq (28.4%, a difference of 0.010%), South American (28.4%, a difference of 0.020%), Immigrants from Nepal (28.4%, a difference of 0.040%), Kenyan (28.4%, a difference of 0.070%), and Nigerian (28.4%, a difference of 0.080%).
DemographicsRating | RankFamily Households with Children
Iraqis
99.9
/100
|
#73
Exceptional
28.5%
Laotians
99.9
/100
|
#74
Exceptional
28.5%
Immigrants | Jordan
99.9
/100
|
#75
Exceptional
28.4%
Immigrants | Sri Lanka
99.9
/100
|
#76
Exceptional
28.4%
Nigerians
99.8
/100
|
#77
Exceptional
28.4%
Immigrants | Nepal
99.8
/100
|
#78
Exceptional
28.4%
Immigrants | Iraq
99.8
/100
|
#79
Exceptional
28.4%
Natives/Alaskans
99.8
/100
|
#80
Exceptional
28.4%
South Americans
99.8
/100
|
#81
Exceptional
28.4%
Kenyans
99.8
/100
|
#82
Exceptional
28.4%
Nicaraguans
99.8
/100
|
#83
Exceptional
28.4%
Costa Ricans
99.8
/100
|
#84
Exceptional
28.4%
Immigrants | Syria
99.8
/100
|
#85
Exceptional
28.4%
Immigrants | Western Africa
99.6
/100
|
#86
Exceptional
28.3%
Colombians
99.6
/100
|
#87
Exceptional
28.3%

Demographics Similar to U.S. Virgin Islanders by Family Households with Children

In terms of family households with children, the demographic groups most similar to U.S. Virgin Islanders are Cuban (27.1%, a difference of 0.0%), Northern European (27.2%, a difference of 0.030%), African (27.2%, a difference of 0.040%), Greek (27.1%, a difference of 0.040%), and Immigrants from Dominica (27.2%, a difference of 0.080%).
DemographicsRating | RankFamily Households with Children
Immigrants | Ukraine
14.4
/100
|
#210
Poor
27.2%
Welsh
14.2
/100
|
#211
Poor
27.2%
Immigrants | Dominica
13.9
/100
|
#212
Poor
27.2%
Okinawans
13.7
/100
|
#213
Poor
27.2%
Africans
13.0
/100
|
#214
Poor
27.2%
Northern Europeans
12.8
/100
|
#215
Poor
27.2%
Cubans
12.2
/100
|
#216
Poor
27.1%
U.S. Virgin Islanders
12.1
/100
|
#217
Poor
27.1%
Greeks
11.4
/100
|
#218
Poor
27.1%
Immigrants | Japan
10.7
/100
|
#219
Poor
27.1%
Austrians
9.9
/100
|
#220
Tragic
27.1%
New Zealanders
9.6
/100
|
#221
Tragic
27.1%
Paraguayans
9.4
/100
|
#222
Tragic
27.1%
Pima
9.2
/100
|
#223
Tragic
27.1%
Germans
8.7
/100
|
#224
Tragic
27.1%