Native/Alaskan vs Slovak Family Households with Children
COMPARE
Native/Alaskan
Slovak
Family Households with Children
Family Households with Children Comparison
Natives/Alaskans
Slovaks
28.4%
FAMILY HOUSEHOLDS WITH CHILDREN
99.8/ 100
METRIC RATING
80th/ 347
METRIC RANK
25.7%
FAMILY HOUSEHOLDS WITH CHILDREN
0.0/ 100
METRIC RATING
334th/ 347
METRIC RANK
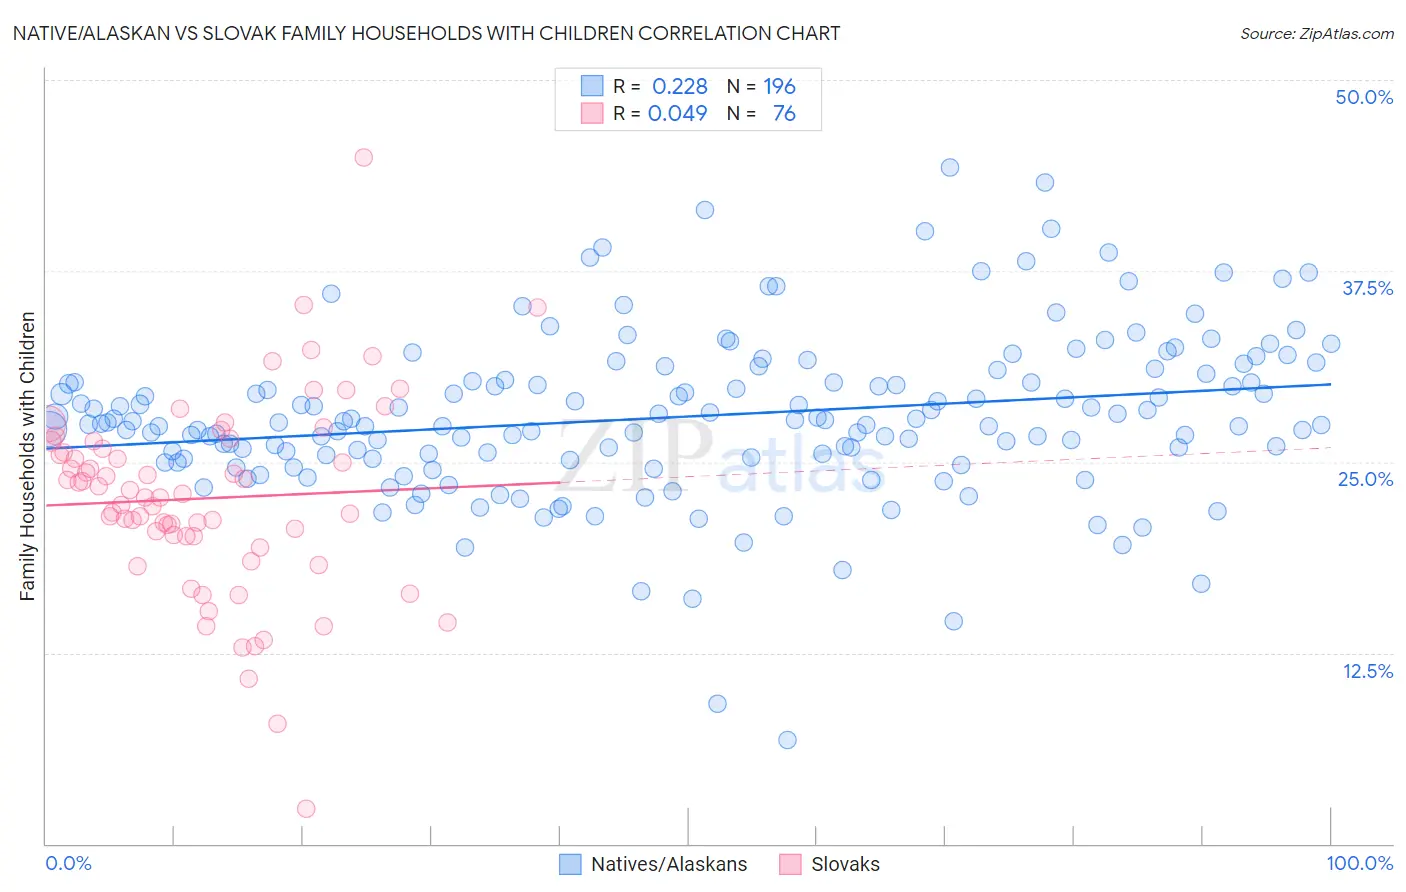
Native/Alaskan vs Slovak Family Households with Children Correlation Chart
The statistical analysis conducted on geographies consisting of 512,450,459 people shows a weak positive correlation between the proportion of Natives/Alaskans and percentage of family households with children in the United States with a correlation coefficient (R) of 0.228 and weighted average of 28.4%. Similarly, the statistical analysis conducted on geographies consisting of 397,479,413 people shows no correlation between the proportion of Slovaks and percentage of family households with children in the United States with a correlation coefficient (R) of 0.049 and weighted average of 25.7%, a difference of 10.5%.
Family Households with Children Correlation Summary
| Measurement | Native/Alaskan | Slovak |
| Minimum | 6.8% | 2.3% |
| Maximum | 44.2% | 45.0% |
| Range | 37.4% | 42.7% |
| Mean | 28.0% | 22.6% |
| Median | 27.6% | 22.8% |
| Interquartile 25% (IQ1) | 25.2% | 20.2% |
| Interquartile 75% (IQ3) | 30.3% | 26.1% |
| Interquartile Range (IQR) | 5.1% | 5.9% |
| Standard Deviation (Sample) | 5.4% | 6.4% |
| Standard Deviation (Population) | 5.4% | 6.4% |
Similar Demographics by Family Households with Children
Demographics Similar to Natives/Alaskans by Family Households with Children
In terms of family households with children, the demographic groups most similar to Natives/Alaskans are Immigrants from Iraq (28.4%, a difference of 0.010%), South American (28.4%, a difference of 0.020%), Immigrants from Nepal (28.4%, a difference of 0.040%), Kenyan (28.4%, a difference of 0.070%), and Nigerian (28.4%, a difference of 0.080%).
| Demographics | Rating | Rank | Family Households with Children |
| Iraqis | 99.9 /100 | #73 | Exceptional 28.5% |
| Laotians | 99.9 /100 | #74 | Exceptional 28.5% |
| Immigrants | Jordan | 99.9 /100 | #75 | Exceptional 28.4% |
| Immigrants | Sri Lanka | 99.9 /100 | #76 | Exceptional 28.4% |
| Nigerians | 99.8 /100 | #77 | Exceptional 28.4% |
| Immigrants | Nepal | 99.8 /100 | #78 | Exceptional 28.4% |
| Immigrants | Iraq | 99.8 /100 | #79 | Exceptional 28.4% |
| Natives/Alaskans | 99.8 /100 | #80 | Exceptional 28.4% |
| South Americans | 99.8 /100 | #81 | Exceptional 28.4% |
| Kenyans | 99.8 /100 | #82 | Exceptional 28.4% |
| Nicaraguans | 99.8 /100 | #83 | Exceptional 28.4% |
| Costa Ricans | 99.8 /100 | #84 | Exceptional 28.4% |
| Immigrants | Syria | 99.8 /100 | #85 | Exceptional 28.4% |
| Immigrants | Western Africa | 99.6 /100 | #86 | Exceptional 28.3% |
| Colombians | 99.6 /100 | #87 | Exceptional 28.3% |
Demographics Similar to Slovaks by Family Households with Children
In terms of family households with children, the demographic groups most similar to Slovaks are Immigrants from Croatia (25.7%, a difference of 0.010%), Immigrants from West Indies (25.7%, a difference of 0.11%), Immigrants from Switzerland (25.7%, a difference of 0.15%), Immigrants from Austria (25.8%, a difference of 0.23%), and Slovene (25.8%, a difference of 0.45%).
| Demographics | Rating | Rank | Family Households with Children |
| Immigrants | Barbados | 0.0 /100 | #327 | Tragic 26.0% |
| Immigrants | Albania | 0.0 /100 | #328 | Tragic 25.9% |
| Cypriots | 0.0 /100 | #329 | Tragic 25.9% |
| Immigrants | Latvia | 0.0 /100 | #330 | Tragic 25.9% |
| Slovenes | 0.0 /100 | #331 | Tragic 25.8% |
| Immigrants | Austria | 0.0 /100 | #332 | Tragic 25.8% |
| Immigrants | Switzerland | 0.0 /100 | #333 | Tragic 25.7% |
| Slovaks | 0.0 /100 | #334 | Tragic 25.7% |
| Immigrants | Croatia | 0.0 /100 | #335 | Tragic 25.7% |
| Immigrants | West Indies | 0.0 /100 | #336 | Tragic 25.7% |
| Puerto Ricans | 0.0 /100 | #337 | Tragic 25.6% |
| Arapaho | 0.0 /100 | #338 | Tragic 25.6% |
| Immigrants | St. Vincent and the Grenadines | 0.0 /100 | #339 | Tragic 25.6% |
| Immigrants | Armenia | 0.0 /100 | #340 | Tragic 25.6% |
| Immigrants | Serbia | 0.0 /100 | #341 | Tragic 25.5% |