Native/Alaskan vs Yakama Family Households with Children
COMPARE
Native/Alaskan
Yakama
Family Households with Children
Family Households with Children Comparison
Natives/Alaskans
Yakama
28.4%
FAMILY HOUSEHOLDS WITH CHILDREN
99.8/ 100
METRIC RATING
80th/ 347
METRIC RANK
30.8%
FAMILY HOUSEHOLDS WITH CHILDREN
100.0/ 100
METRIC RATING
8th/ 347
METRIC RANK
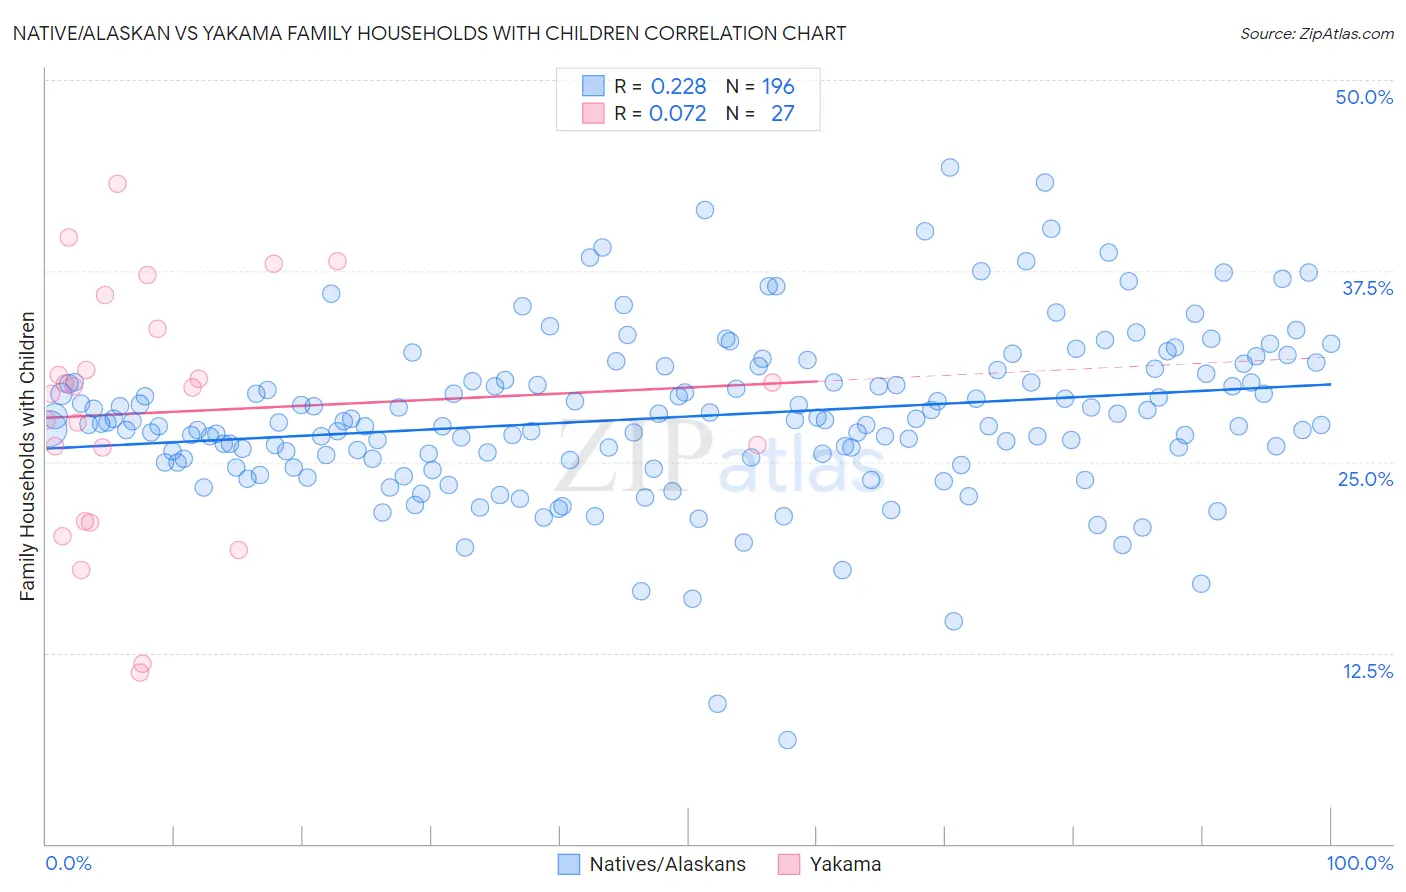
Native/Alaskan vs Yakama Family Households with Children Correlation Chart
The statistical analysis conducted on geographies consisting of 512,450,459 people shows a weak positive correlation between the proportion of Natives/Alaskans and percentage of family households with children in the United States with a correlation coefficient (R) of 0.228 and weighted average of 28.4%. Similarly, the statistical analysis conducted on geographies consisting of 19,917,879 people shows a slight positive correlation between the proportion of Yakama and percentage of family households with children in the United States with a correlation coefficient (R) of 0.072 and weighted average of 30.8%, a difference of 8.4%.
Family Households with Children Correlation Summary
| Measurement | Native/Alaskan | Yakama |
| Minimum | 6.8% | 11.2% |
| Maximum | 44.2% | 43.2% |
| Range | 37.4% | 32.0% |
| Mean | 28.0% | 28.3% |
| Median | 27.6% | 29.9% |
| Interquartile 25% (IQ1) | 25.2% | 21.1% |
| Interquartile 75% (IQ3) | 30.3% | 33.7% |
| Interquartile Range (IQR) | 5.1% | 12.6% |
| Standard Deviation (Sample) | 5.4% | 8.0% |
| Standard Deviation (Population) | 5.4% | 7.9% |
Similar Demographics by Family Households with Children
Demographics Similar to Natives/Alaskans by Family Households with Children
In terms of family households with children, the demographic groups most similar to Natives/Alaskans are Immigrants from Iraq (28.4%, a difference of 0.010%), South American (28.4%, a difference of 0.020%), Immigrants from Nepal (28.4%, a difference of 0.040%), Kenyan (28.4%, a difference of 0.070%), and Nigerian (28.4%, a difference of 0.080%).
| Demographics | Rating | Rank | Family Households with Children |
| Iraqis | 99.9 /100 | #73 | Exceptional 28.5% |
| Laotians | 99.9 /100 | #74 | Exceptional 28.5% |
| Immigrants | Jordan | 99.9 /100 | #75 | Exceptional 28.4% |
| Immigrants | Sri Lanka | 99.9 /100 | #76 | Exceptional 28.4% |
| Nigerians | 99.8 /100 | #77 | Exceptional 28.4% |
| Immigrants | Nepal | 99.8 /100 | #78 | Exceptional 28.4% |
| Immigrants | Iraq | 99.8 /100 | #79 | Exceptional 28.4% |
| Natives/Alaskans | 99.8 /100 | #80 | Exceptional 28.4% |
| South Americans | 99.8 /100 | #81 | Exceptional 28.4% |
| Kenyans | 99.8 /100 | #82 | Exceptional 28.4% |
| Nicaraguans | 99.8 /100 | #83 | Exceptional 28.4% |
| Costa Ricans | 99.8 /100 | #84 | Exceptional 28.4% |
| Immigrants | Syria | 99.8 /100 | #85 | Exceptional 28.4% |
| Immigrants | Western Africa | 99.6 /100 | #86 | Exceptional 28.3% |
| Colombians | 99.6 /100 | #87 | Exceptional 28.3% |
Demographics Similar to Yakama by Family Households with Children
In terms of family households with children, the demographic groups most similar to Yakama are Thai (30.6%, a difference of 0.48%), Immigrants from Central America (31.0%, a difference of 0.57%), Immigrants from Fiji (30.5%, a difference of 0.80%), Immigrants from India (31.0%, a difference of 0.87%), and Nepalese (30.5%, a difference of 0.88%).
| Demographics | Rating | Rank | Family Households with Children |
| Yup'ik | 100 /100 | #1 | Exceptional 37.0% |
| Inupiat | 100 /100 | #2 | Exceptional 32.8% |
| Immigrants | Mexico | 100.0 /100 | #3 | Exceptional 31.6% |
| Mexicans | 100.0 /100 | #4 | Exceptional 31.4% |
| Tongans | 100.0 /100 | #5 | Exceptional 31.2% |
| Immigrants | India | 100.0 /100 | #6 | Exceptional 31.0% |
| Immigrants | Central America | 100.0 /100 | #7 | Exceptional 31.0% |
| Yakama | 100.0 /100 | #8 | Exceptional 30.8% |
| Thais | 100.0 /100 | #9 | Exceptional 30.6% |
| Immigrants | Fiji | 100.0 /100 | #10 | Exceptional 30.5% |
| Nepalese | 100.0 /100 | #11 | Exceptional 30.5% |
| Immigrants | Pakistan | 100.0 /100 | #12 | Exceptional 30.2% |
| Afghans | 100.0 /100 | #13 | Exceptional 30.2% |
| Bangladeshis | 100.0 /100 | #14 | Exceptional 30.1% |
| Immigrants | South Central Asia | 100.0 /100 | #15 | Exceptional 30.0% |