Native/Alaskan vs Zimbabwean Family Households with Children
COMPARE
Native/Alaskan
Zimbabwean
Family Households with Children
Family Households with Children Comparison
Natives/Alaskans
Zimbabweans
28.4%
FAMILY HOUSEHOLDS WITH CHILDREN
99.8/ 100
METRIC RATING
80th/ 347
METRIC RANK
27.9%
FAMILY HOUSEHOLDS WITH CHILDREN
95.6/ 100
METRIC RATING
119th/ 347
METRIC RANK
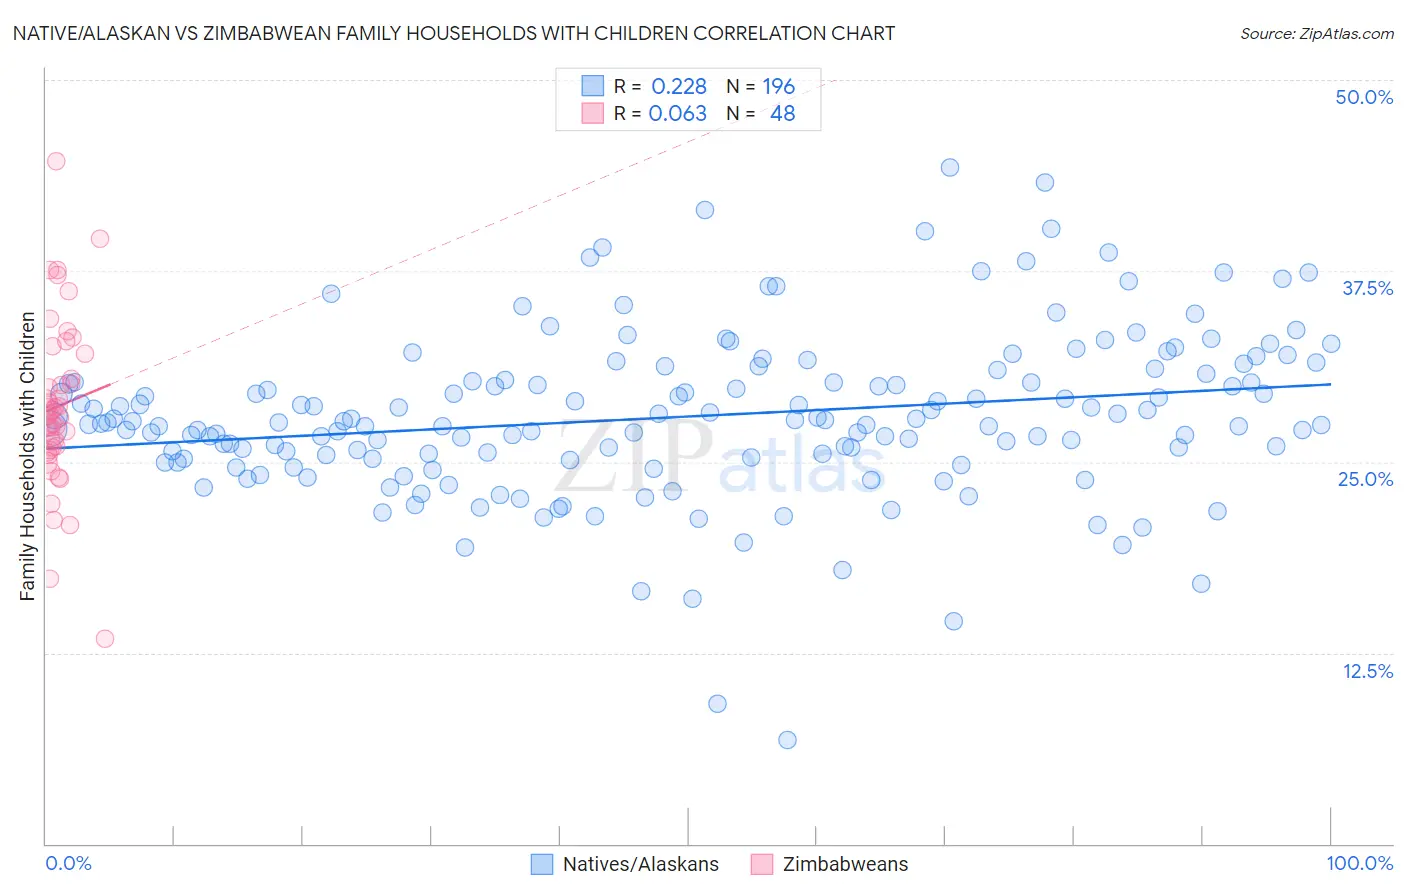
Native/Alaskan vs Zimbabwean Family Households with Children Correlation Chart
The statistical analysis conducted on geographies consisting of 512,450,459 people shows a weak positive correlation between the proportion of Natives/Alaskans and percentage of family households with children in the United States with a correlation coefficient (R) of 0.228 and weighted average of 28.4%. Similarly, the statistical analysis conducted on geographies consisting of 69,170,412 people shows a slight positive correlation between the proportion of Zimbabweans and percentage of family households with children in the United States with a correlation coefficient (R) of 0.063 and weighted average of 27.9%, a difference of 1.8%.
Family Households with Children Correlation Summary
| Measurement | Native/Alaskan | Zimbabwean |
| Minimum | 6.8% | 13.4% |
| Maximum | 44.2% | 44.7% |
| Range | 37.4% | 31.3% |
| Mean | 28.0% | 28.6% |
| Median | 27.6% | 28.1% |
| Interquartile 25% (IQ1) | 25.2% | 25.8% |
| Interquartile 75% (IQ3) | 30.3% | 31.3% |
| Interquartile Range (IQR) | 5.1% | 5.4% |
| Standard Deviation (Sample) | 5.4% | 5.6% |
| Standard Deviation (Population) | 5.4% | 5.5% |
Similar Demographics by Family Households with Children
Demographics Similar to Natives/Alaskans by Family Households with Children
In terms of family households with children, the demographic groups most similar to Natives/Alaskans are Immigrants from Iraq (28.4%, a difference of 0.010%), South American (28.4%, a difference of 0.020%), Immigrants from Nepal (28.4%, a difference of 0.040%), Kenyan (28.4%, a difference of 0.070%), and Nigerian (28.4%, a difference of 0.080%).
| Demographics | Rating | Rank | Family Households with Children |
| Iraqis | 99.9 /100 | #73 | Exceptional 28.5% |
| Laotians | 99.9 /100 | #74 | Exceptional 28.5% |
| Immigrants | Jordan | 99.9 /100 | #75 | Exceptional 28.4% |
| Immigrants | Sri Lanka | 99.9 /100 | #76 | Exceptional 28.4% |
| Nigerians | 99.8 /100 | #77 | Exceptional 28.4% |
| Immigrants | Nepal | 99.8 /100 | #78 | Exceptional 28.4% |
| Immigrants | Iraq | 99.8 /100 | #79 | Exceptional 28.4% |
| Natives/Alaskans | 99.8 /100 | #80 | Exceptional 28.4% |
| South Americans | 99.8 /100 | #81 | Exceptional 28.4% |
| Kenyans | 99.8 /100 | #82 | Exceptional 28.4% |
| Nicaraguans | 99.8 /100 | #83 | Exceptional 28.4% |
| Costa Ricans | 99.8 /100 | #84 | Exceptional 28.4% |
| Immigrants | Syria | 99.8 /100 | #85 | Exceptional 28.4% |
| Immigrants | Western Africa | 99.6 /100 | #86 | Exceptional 28.3% |
| Colombians | 99.6 /100 | #87 | Exceptional 28.3% |
Demographics Similar to Zimbabweans by Family Households with Children
In terms of family households with children, the demographic groups most similar to Zimbabweans are European (27.9%, a difference of 0.030%), Immigrants from Malaysia (27.9%, a difference of 0.040%), Central American Indian (27.9%, a difference of 0.040%), Pakistani (27.9%, a difference of 0.050%), and Immigrants from Africa (28.0%, a difference of 0.18%).
| Demographics | Rating | Rank | Family Households with Children |
| Immigrants | Middle Africa | 97.0 /100 | #112 | Exceptional 28.0% |
| Arabs | 97.0 /100 | #113 | Exceptional 28.0% |
| South American Indians | 96.9 /100 | #114 | Exceptional 28.0% |
| Immigrants | Africa | 96.8 /100 | #115 | Exceptional 28.0% |
| Pakistanis | 96.0 /100 | #116 | Exceptional 27.9% |
| Immigrants | Malaysia | 95.9 /100 | #117 | Exceptional 27.9% |
| Central American Indians | 95.9 /100 | #118 | Exceptional 27.9% |
| Zimbabweans | 95.6 /100 | #119 | Exceptional 27.9% |
| Europeans | 95.4 /100 | #120 | Exceptional 27.9% |
| Immigrants | Western Asia | 93.6 /100 | #121 | Exceptional 27.9% |
| Immigrants | Zimbabwe | 92.8 /100 | #122 | Exceptional 27.8% |
| Immigrants | Northern Africa | 91.8 /100 | #123 | Exceptional 27.8% |
| Immigrants | Singapore | 90.8 /100 | #124 | Exceptional 27.8% |
| Ecuadorians | 90.8 /100 | #125 | Exceptional 27.8% |
| Immigrants | Ethiopia | 90.5 /100 | #126 | Exceptional 27.8% |