Immigrants from Ethiopia vs Bulgarian Family Households with Children

COMPARE

Immigrants from Ethiopia
Race
Ancestry
AfghanAfricanAlaska NativeAlaskan AthabascanAlbanianAleutAlsatianAmericanApacheArabArapahoArgentineanArmenianAssyrian/Chaldean/SyriacAustralianAustrianBahamianBangladeshiBarbadianBasqueBelgianBelizeanBermudanBhutaneseBlackfeetBolivianBrazilianBritishBritish West IndianBurmeseCajunCambodianCanadianCape VerdeanCarpatho RusynCelticCentral AmericanCentral American IndianCherokeeCheyenneChickasawChileanChineseChippewaChoctawColombianColvilleComancheCosta RicanCreeCreekCroatianCrowCubanCypriotCzechCzechoslovakianDanishDelawareDominicanDutchDutch West IndianEastern EuropeanEcuadorianEgyptianEnglishEstonianEthiopianEuropeanFijianFilipinoFinnishFrenchFrench American IndianFrench CanadianGermanGerman RussianGhanaianGreekGuamanian/ChamorroGuatemalanGuyaneseHaitianHmongHonduranHopiHoumaHungarianIcelanderIndian (Asian)IndonesianInupiatIranianIraqiIrishIroquoisIsraeliItalianJamaicanJapaneseJordanianKenyanKiowaKoreanLaotianLatvianLebaneseLiberianLithuanianLumbeeLuxembourgerMacedonianMalaysianMalteseMarshalleseMenomineeMexicanMexican American IndianMongolianMoroccanNative HawaiianNavajoNepaleseNew ZealanderNicaraguanNigerianNorthern EuropeanNorwegianOkinawanOsageOttawaPaiutePakistaniPalestinianPanamanianParaguayanPennsylvania GermanPeruvianPimaPolishPortuguesePotawatomiPuebloPuerto RicanPuget Sound SalishRomanianRussianSalvadoranSamoanScandinavianScotch-IrishScottishSeminoleSenegaleseSerbianShoshoneSierra LeoneanSiouxSlavicSlovakSloveneSomaliSouth AfricanSouth AmericanSouth American IndianSoviet UnionSpaniardSpanishSpanish AmericanSpanish American IndianSri LankanSubsaharan AfricanSudaneseSwedishSwissSyrianTaiwaneseThaiTlingit-HaidaTohono O'OdhamTonganTrinidadian and TobagonianTsimshianTurkishU.S. Virgin IslanderUgandanUkrainianUruguayanUteVenezuelanVietnameseWelshWest IndianYakamaYaquiYugoslavianYumanYup'ikZimbabwean
Immigration
NonimmigrantsImmigrantsAfghanistanAfricaAlbaniaArgentinaArmeniaAsiaAustraliaAustriaBahamasBangladeshBarbadosBelarusBelgiumBelizeBoliviaBosnia and HerzegovinaBrazilBulgariaBurma/MyanmarCabo VerdeCambodiaCameroonCanadaCaribbeanCentral AmericaChileChinaColombiaCongoCosta RicaCroatiaCubaCzechoslovakiaDenmarkDominicaDominican RepublicEastern AfricaEastern AsiaEastern EuropeEcuadorEgyptEl SalvadorEnglandEritreaEthiopiaEuropeFijiFranceGermanyGhanaGreeceGrenadaGuatemalaGuyanaHaitiHondurasHong KongHungaryIndiaIndonesiaIranIraqIrelandIsraelItalyJamaicaJapanJordanKazakhstanKenyaKoreaKuwaitLaosLatin AmericaLatviaLebanonLiberiaLithuaniaMalaysiaMexicoMicronesiaMiddle AfricaMoldovaMoroccoNepalNetherlandsNicaraguaNigeriaNorth AmericaNorth MacedoniaNorthern AfricaNorthern EuropeNorwayOceaniaPakistanPanamaPeruPhilippinesPolandPortugalRomaniaRussiaSaudi ArabiaScotlandSenegalSerbiaSierra LeoneSingaporeSomaliaSouth AfricaSouth AmericaSouth Central AsiaSouth Eastern AsiaSouthern EuropeSpainSri LankaSt. Vincent and the GrenadinesSudanSwedenSwitzerlandSyriaTaiwanThailandTrinidad and TobagoTurkeyUgandaUkraineUruguayUzbekistanVenezuelaVietnamWest IndiesWestern AfricaWestern AsiaWestern EuropeYemenZaireZimbabweAzores
Bulgarian
Race
Ancestry
AfghanAfricanAlaska NativeAlaskan AthabascanAlbanianAleutAlsatianAmericanApacheArabArapahoArgentineanArmenianAssyrian/Chaldean/SyriacAustralianAustrianBahamianBangladeshiBarbadianBasqueBelgianBelizeanBermudanBhutaneseBlackfeetBolivianBrazilianBritishBritish West IndianBulgarianBurmeseCajunCambodianCanadianCape VerdeanCarpatho RusynCelticCentral AmericanCentral American IndianCherokeeCheyenneChickasawChileanChineseChippewaChoctawColombianColvilleComancheCosta RicanCreeCreekCroatianCrowCubanCypriotCzechCzechoslovakianDanishDelawareDominicanDutchDutch West IndianEastern EuropeanEcuadorianEgyptianEnglishEstonianEthiopianEuropeanFijianFilipinoFinnishFrenchFrench American IndianFrench CanadianGermanGerman RussianGhanaianGreekGuamanian/ChamorroGuatemalanGuyaneseHaitianHmongHonduranHopiHoumaHungarianIcelanderIndian (Asian)IndonesianInupiatIranianIraqiIrishIroquoisIsraeliItalianJamaicanJapaneseJordanianKenyanKiowaKoreanLaotianLatvianLebaneseLiberianLithuanianLumbeeLuxembourgerMacedonianMalaysianMalteseMarshalleseMenomineeMexicanMexican American IndianMongolianMoroccanNative HawaiianNavajoNepaleseNew ZealanderNicaraguanNigerianNorthern EuropeanNorwegianOkinawanOsageOttawaPaiutePakistaniPalestinianPanamanianParaguayanPennsylvania GermanPeruvianPimaPolishPortuguesePotawatomiPuebloPuerto RicanPuget Sound SalishRomanianRussianSalvadoranSamoanScandinavianScotch-IrishScottishSeminoleSenegaleseSerbianShoshoneSierra LeoneanSiouxSlavicSlovakSloveneSomaliSouth AfricanSouth AmericanSouth American IndianSoviet UnionSpaniardSpanishSpanish AmericanSpanish American IndianSri LankanSubsaharan AfricanSudaneseSwedishSwissSyrianTaiwaneseThaiTlingit-HaidaTohono O'OdhamTonganTrinidadian and TobagonianTsimshianTurkishU.S. Virgin IslanderUgandanUkrainianUruguayanUteVenezuelanVietnameseWelshWest IndianYakamaYaquiYugoslavianYumanYup'ikZimbabwean
Immigration
NonimmigrantsImmigrantsAfghanistanAfricaAlbaniaArgentinaArmeniaAsiaAustraliaAustriaBahamasBangladeshBarbadosBelarusBelgiumBelizeBoliviaBosnia and HerzegovinaBrazilBulgariaBurma/MyanmarCabo VerdeCambodiaCameroonCanadaCaribbeanCentral AmericaChileChinaColombiaCongoCosta RicaCroatiaCubaCzechoslovakiaDenmarkDominicaDominican RepublicEastern AfricaEastern AsiaEastern EuropeEcuadorEgyptEl SalvadorEnglandEritreaEuropeFijiFranceGermanyGhanaGreeceGrenadaGuatemalaGuyanaHaitiHondurasHong KongHungaryIndiaIndonesiaIranIraqIrelandIsraelItalyJamaicaJapanJordanKazakhstanKenyaKoreaKuwaitLaosLatin AmericaLatviaLebanonLiberiaLithuaniaMalaysiaMexicoMicronesiaMiddle AfricaMoldovaMoroccoNepalNetherlandsNicaraguaNigeriaNorth AmericaNorth MacedoniaNorthern AfricaNorthern EuropeNorwayOceaniaPakistanPanamaPeruPhilippinesPolandPortugalRomaniaRussiaSaudi ArabiaScotlandSenegalSerbiaSierra LeoneSingaporeSomaliaSouth AfricaSouth AmericaSouth Central AsiaSouth Eastern AsiaSouthern EuropeSpainSri LankaSt. Vincent and the GrenadinesSudanSwedenSwitzerlandSyriaTaiwanThailandTrinidad and TobagoTurkeyUgandaUkraineUruguayUzbekistanVenezuelaVietnamWest IndiesWestern AfricaWestern AsiaWestern EuropeYemenZaireZimbabweAzores
Family Households with Children
Income
Poverty
Unemployment
Labor Participation
Family Structure
Vehicle Availability
Education Level
Disability

Family Households with Children Comparison

Immigrants from Ethiopia

Bulgarians

Exceptional
Tragic
27.8%
FAMILY HOUSEHOLDS WITH CHILDREN
90.5/ 100
METRIC RATING
126th/ 347
METRIC RANK
27.0%
FAMILY HOUSEHOLDS WITH CHILDREN
5.8/ 100
METRIC RATING
230th/ 347
METRIC RANK

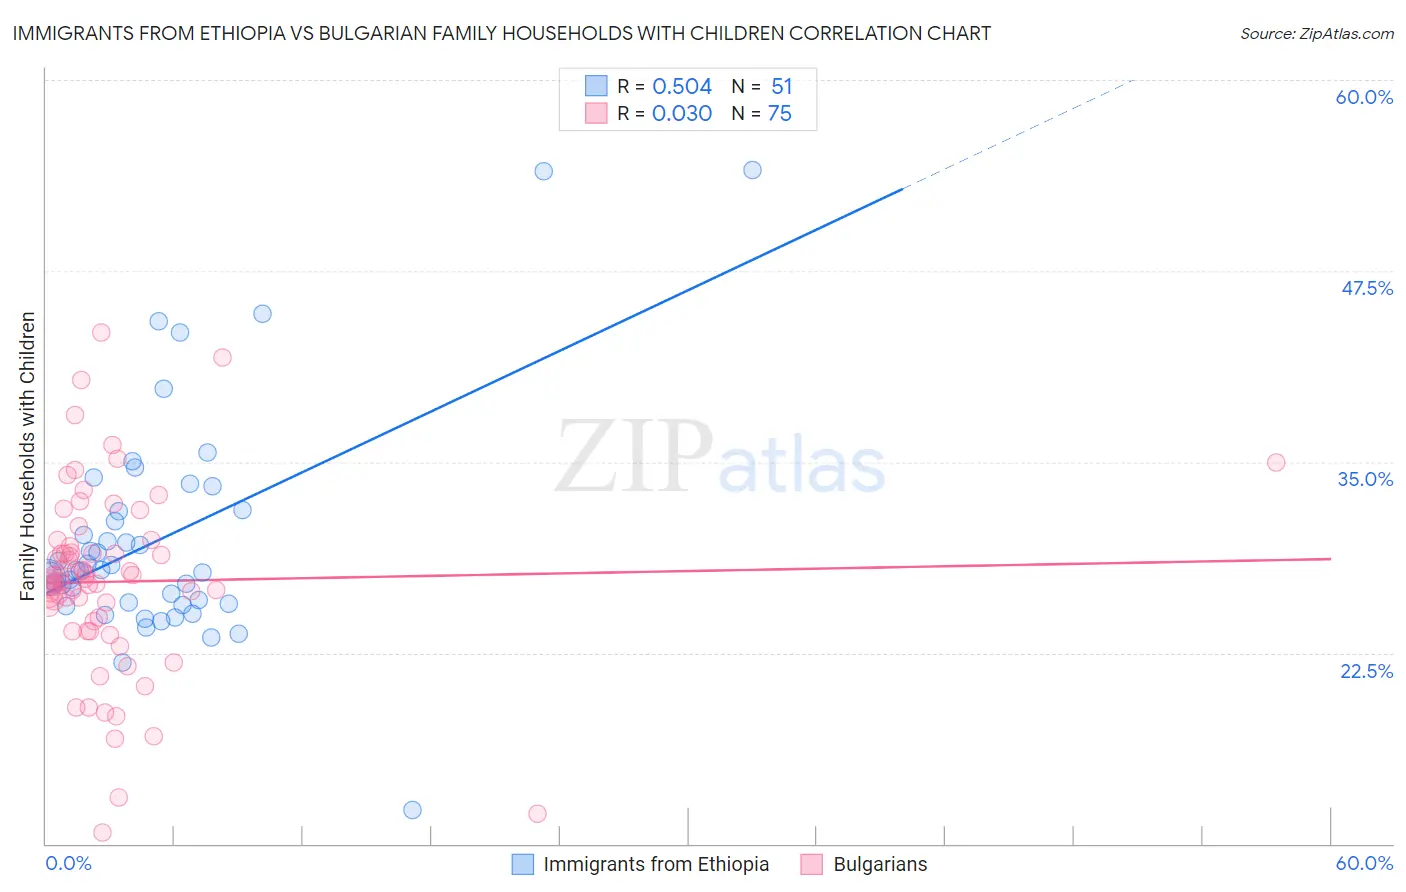
Immigrants from Ethiopia vs Bulgarian Family Households with Children Correlation Chart

The statistical analysis conducted on geographies consisting of 211,422,871 people shows a substantial positive correlation between the proportion of Immigrants from Ethiopia and percentage of family households with children in the United States with a correlation coefficient (R) of 0.504 and weighted average of 27.8%. Similarly, the statistical analysis conducted on geographies consisting of 205,477,079 people shows no correlation between the proportion of Bulgarians and percentage of family households with children in the United States with a correlation coefficient (R) of 0.030 and weighted average of 27.0%, a difference of 2.8%.
Immigrants from Ethiopia vs Bulgarian Family Households with Children

Family Households with Children Correlation Summary

MeasurementImmigrants from EthiopiaBulgarian
Minimum12.2%10.8%
Maximum54.1%43.4%
Range41.9%32.7%
Mean30.0%27.2%
Median27.9%27.3%
Interquartile 25% (IQ1)25.7%24.6%
Interquartile 75% (IQ3)31.9%29.5%
Interquartile Range (IQR)6.2%4.9%
Standard Deviation (Sample)7.5%6.1%
Standard Deviation (Population)7.4%6.0%

Similar Demographics by Family Households with Children

Demographics Similar to Immigrants from Ethiopia by Family Households with Children

In terms of family households with children, the demographic groups most similar to Immigrants from Ethiopia are Immigrants from Singapore (27.8%, a difference of 0.020%), Ecuadorian (27.8%, a difference of 0.020%), Belizean (27.8%, a difference of 0.030%), Syrian (27.8%, a difference of 0.050%), and Immigrants from Eritrea (27.8%, a difference of 0.070%).
DemographicsRating | RankFamily Households with Children
Zimbabweans
95.6
/100
|
#119
Exceptional
27.9%
Europeans
95.4
/100
|
#120
Exceptional
27.9%
Immigrants | Western Asia
93.6
/100
|
#121
Exceptional
27.9%
Immigrants | Zimbabwe
92.8
/100
|
#122
Exceptional
27.8%
Immigrants | Northern Africa
91.8
/100
|
#123
Exceptional
27.8%
Immigrants | Singapore
90.8
/100
|
#124
Exceptional
27.8%
Ecuadorians
90.8
/100
|
#125
Exceptional
27.8%
Immigrants | Ethiopia
90.5
/100
|
#126
Exceptional
27.8%
Belizeans
90.0
/100
|
#127
Exceptional
27.8%
Syrians
89.7
/100
|
#128
Excellent
27.8%
Immigrants | Eritrea
89.4
/100
|
#129
Excellent
27.8%
Cajuns
87.6
/100
|
#130
Excellent
27.7%
Lebanese
87.4
/100
|
#131
Excellent
27.7%
Immigrants | Belize
85.7
/100
|
#132
Excellent
27.7%
Iranians
85.2
/100
|
#133
Excellent
27.7%

Demographics Similar to Bulgarians by Family Households with Children

In terms of family households with children, the demographic groups most similar to Bulgarians are Luxembourger (27.0%, a difference of 0.030%), Immigrants from Caribbean (27.0%, a difference of 0.050%), Yugoslavian (27.0%, a difference of 0.070%), Czechoslovakian (27.0%, a difference of 0.080%), and Tsimshian (27.0%, a difference of 0.080%).
DemographicsRating | RankFamily Households with Children
Pima
9.2
/100
|
#223
Tragic
27.1%
Germans
8.7
/100
|
#224
Tragic
27.1%
Canadians
7.5
/100
|
#225
Tragic
27.1%
Czechoslovakians
6.6
/100
|
#226
Tragic
27.0%
Tsimshian
6.6
/100
|
#227
Tragic
27.0%
Scottish
6.5
/100
|
#228
Tragic
27.0%
Immigrants | Caribbean
6.3
/100
|
#229
Tragic
27.0%
Bulgarians
5.8
/100
|
#230
Tragic
27.0%
Luxembourgers
5.5
/100
|
#231
Tragic
27.0%
Yugoslavians
5.1
/100
|
#232
Tragic
27.0%
Immigrants | Italy
5.0
/100
|
#233
Tragic
27.0%
Immigrants | Germany
4.4
/100
|
#234
Tragic
27.0%
Immigrants | Morocco
4.2
/100
|
#235
Tragic
27.0%
Cape Verdeans
3.6
/100
|
#236
Tragic
26.9%
Immigrants | Netherlands
3.5
/100
|
#237
Tragic
26.9%