Native/Alaskan vs Assyrian/Chaldean/Syriac Disability
COMPARE
Native/Alaskan
Assyrian/Chaldean/Syriac
Disability
Disability Comparison
Natives/Alaskans
Assyrians/Chaldeans/Syriacs
14.2%
DISABILITY
0.0/ 100
METRIC RATING
325th/ 347
METRIC RANK
11.9%
DISABILITY
12.6/ 100
METRIC RATING
201st/ 347
METRIC RANK
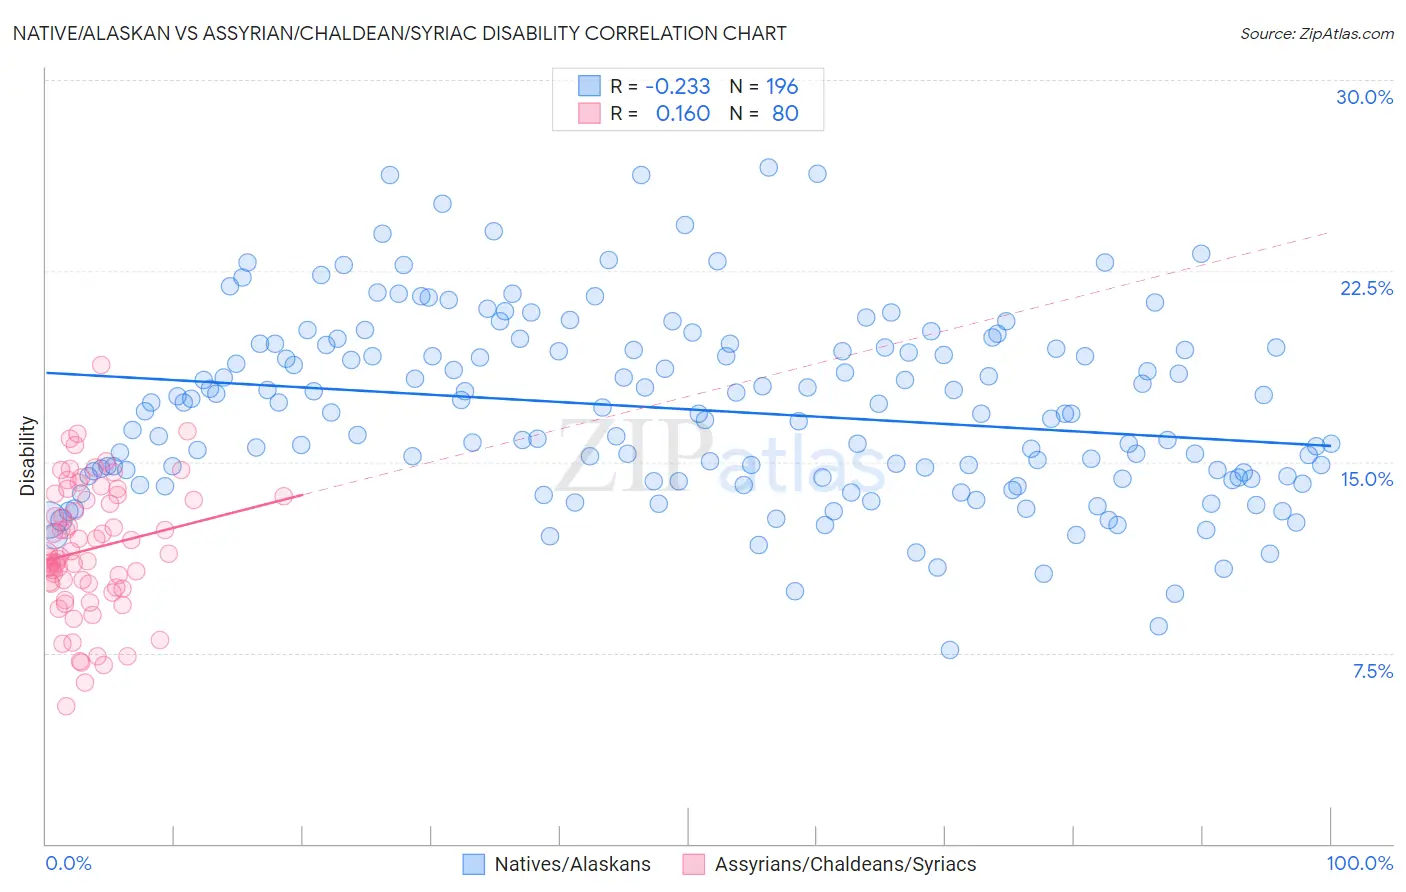
Native/Alaskan vs Assyrian/Chaldean/Syriac Disability Correlation Chart
The statistical analysis conducted on geographies consisting of 512,916,136 people shows a weak negative correlation between the proportion of Natives/Alaskans and percentage of population with a disability in the United States with a correlation coefficient (R) of -0.233 and weighted average of 14.2%. Similarly, the statistical analysis conducted on geographies consisting of 110,312,508 people shows a poor positive correlation between the proportion of Assyrians/Chaldeans/Syriacs and percentage of population with a disability in the United States with a correlation coefficient (R) of 0.160 and weighted average of 11.9%, a difference of 18.4%.
Disability Correlation Summary
| Measurement | Native/Alaskan | Assyrian/Chaldean/Syriac |
| Minimum | 7.6% | 5.4% |
| Maximum | 26.5% | 18.8% |
| Range | 18.9% | 13.4% |
| Mean | 17.1% | 11.6% |
| Median | 16.9% | 11.2% |
| Interquartile 25% (IQ1) | 14.4% | 10.1% |
| Interquartile 75% (IQ3) | 19.5% | 13.6% |
| Interquartile Range (IQR) | 5.1% | 3.5% |
| Standard Deviation (Sample) | 3.6% | 2.6% |
| Standard Deviation (Population) | 3.6% | 2.6% |
Similar Demographics by Disability
Demographics Similar to Natives/Alaskans by Disability
In terms of disability, the demographic groups most similar to Natives/Alaskans are Osage (14.2%, a difference of 0.030%), Chippewa (14.1%, a difference of 0.050%), Ottawa (14.2%, a difference of 0.060%), Immigrants from the Azores (14.2%, a difference of 0.060%), and Potawatomi (14.2%, a difference of 0.17%).
| Demographics | Rating | Rank | Disability |
| Menominee | 0.0 /100 | #318 | Tragic 13.8% |
| Iroquois | 0.0 /100 | #319 | Tragic 13.8% |
| Apache | 0.0 /100 | #320 | Tragic 13.9% |
| Paiute | 0.0 /100 | #321 | Tragic 13.9% |
| Americans | 0.0 /100 | #322 | Tragic 13.9% |
| Comanche | 0.0 /100 | #323 | Tragic 14.1% |
| Chippewa | 0.0 /100 | #324 | Tragic 14.1% |
| Natives/Alaskans | 0.0 /100 | #325 | Tragic 14.2% |
| Osage | 0.0 /100 | #326 | Tragic 14.2% |
| Ottawa | 0.0 /100 | #327 | Tragic 14.2% |
| Immigrants | Azores | 0.0 /100 | #328 | Tragic 14.2% |
| Potawatomi | 0.0 /100 | #329 | Tragic 14.2% |
| Navajo | 0.0 /100 | #330 | Tragic 14.3% |
| Alaskan Athabascans | 0.0 /100 | #331 | Tragic 14.4% |
| Pueblo | 0.0 /100 | #332 | Tragic 14.4% |
Demographics Similar to Assyrians/Chaldeans/Syriacs by Disability
In terms of disability, the demographic groups most similar to Assyrians/Chaldeans/Syriacs are Belizean (11.9%, a difference of 0.020%), Immigrants from England (12.0%, a difference of 0.070%), British West Indian (12.0%, a difference of 0.12%), Mexican American Indian (12.0%, a difference of 0.12%), and Immigrants from Panama (11.9%, a difference of 0.18%).
| Demographics | Rating | Rank | Disability |
| Somalis | 17.3 /100 | #194 | Poor 11.9% |
| Barbadians | 15.8 /100 | #195 | Poor 11.9% |
| Serbians | 15.4 /100 | #196 | Poor 11.9% |
| Immigrants | Belize | 15.2 /100 | #197 | Poor 11.9% |
| Ukrainians | 14.7 /100 | #198 | Poor 11.9% |
| Immigrants | Panama | 14.6 /100 | #199 | Poor 11.9% |
| Belizeans | 12.8 /100 | #200 | Poor 11.9% |
| Assyrians/Chaldeans/Syriacs | 12.6 /100 | #201 | Poor 11.9% |
| Immigrants | England | 12.0 /100 | #202 | Poor 12.0% |
| British West Indians | 11.5 /100 | #203 | Poor 12.0% |
| Mexican American Indians | 11.4 /100 | #204 | Poor 12.0% |
| Immigrants | Western Europe | 10.1 /100 | #205 | Poor 12.0% |
| Immigrants | Senegal | 9.4 /100 | #206 | Tragic 12.0% |
| Immigrants | Thailand | 9.3 /100 | #207 | Tragic 12.0% |
| Immigrants | Caribbean | 9.1 /100 | #208 | Tragic 12.0% |